The effect of different passivation and etching cycle durations is studied on a structure composed of a substrate and a
![]() thick mask which has a cylindrical hole with
thick mask which has a cylindrical hole with
![]() diameter. Despite the rotational symmetry, this problem cannot be straightforwardly reduced to two dimensions. The introduction of cylindrical coordinates leads to non-linear particle trajectories, which makes the determination of the visibilities between two points on the surface much more difficult. For convex holes, where all points are visible between each other, the solution of the transport equation for cylindrical coordinates using the conventional approach was demonstrated in [62]. However, due to the rippled, non-convex side walls of the hole, which evolve during the Bosch process, this method cannot be applied.
diameter. Despite the rotational symmetry, this problem cannot be straightforwardly reduced to two dimensions. The introduction of cylindrical coordinates leads to non-linear particle trajectories, which makes the determination of the visibilities between two points on the surface much more difficult. For convex holes, where all points are visible between each other, the solution of the transport equation for cylindrical coordinates using the conventional approach was demonstrated in [62]. However, due to the rippled, non-convex side walls of the hole, which evolve during the Bosch process, this method cannot be applied.
In three dimensions, the simulation domain can be reduced to a quarter due to the reflective boundary conditions and the twofold reflection symmetry of the hole. However, to prove the symmetry of the solution and to avoid reflections, the final visualizations are generated with a process simulation on half of the domain, which is discretized using a grid with lateral extensions
![]() . The grid spacing is
. The grid spacing is
![]() for all simulations. 1.96 million particles are launched from the source plane at every time step.
for all simulations. 1.96 million particles are launched from the source plane at every time step.
The final profiles, after 20 cycles with different process times for deposition (
![]() ,
,
![]() ,
,
![]() , and
, and
![]() ) and etching (
) and etching (
![]() ,
,
![]() , and
, and
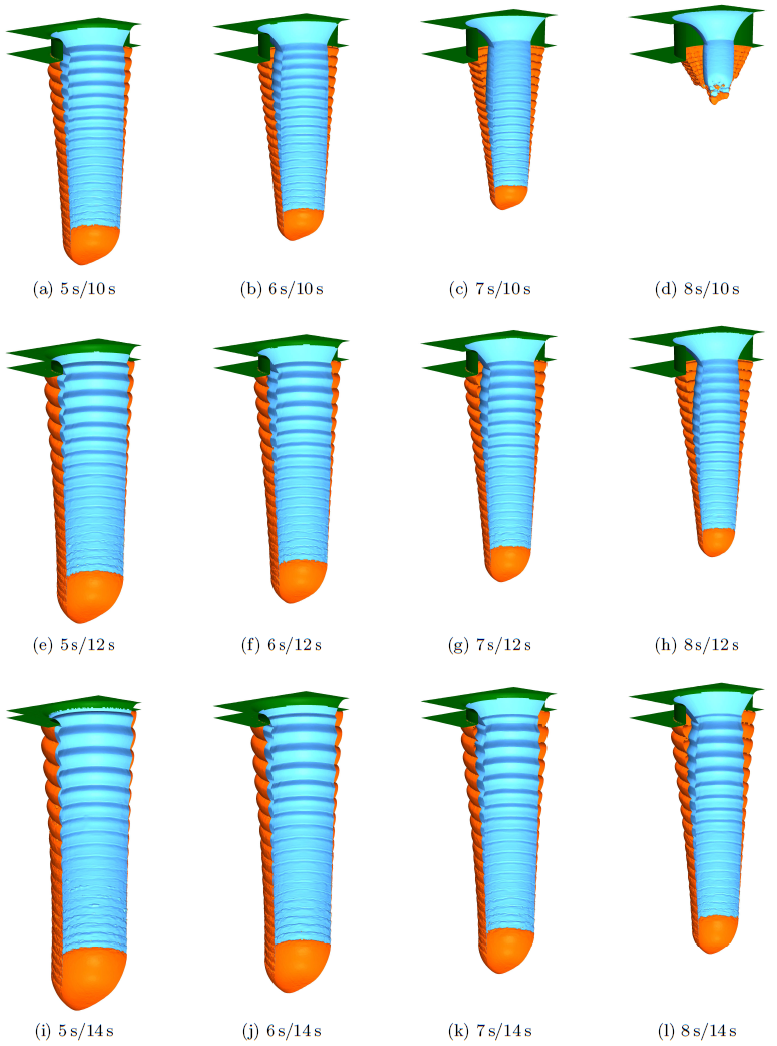
![]() ) are given in Figure 6.9. The results show the influence of the process time on the depths of the holes, tilt angles of the side walls, and the resulting polymer layers. Since mask etching is also incorporated, its final thickness can be studied. Such simulations can help find the optimal process parameters.
) are given in Figure 6.9. The results show the influence of the process time on the depths of the holes, tilt angles of the side walls, and the resulting polymer layers. Since mask etching is also incorporated, its final thickness can be studied. Such simulations can help find the optimal process parameters.
 |