The influence of the hole diameter on the final profile is further investigated. A Bosch process with
![]() passivation followed by
passivation followed by
![]() etching cycles is applied on a
etching cycles is applied on a
![]() thick perforated mask with cylindrical holes of varying diameters (
thick perforated mask with cylindrical holes of varying diameters (
![]() ,
,
![]() ,
,
![]() ,
,
![]() , and
, and
![]() ).
).
The simulation domain is resolved on a grid with extensions
![]() . 12.5 million particles are simulated for each time step. Using 8 cores of AMD Opteron 8222 SE processors (
. 12.5 million particles are simulated for each time step. Using 8 cores of AMD Opteron 8222 SE processors (
![]() ) the total computation time is approximately 2 days. Approximately 6500 time steps are necessary to simulate all 20 cycles of the Bosch process. The calculation time for one time step is
) the total computation time is approximately 2 days. Approximately 6500 time steps are necessary to simulate all 20 cycles of the Bosch process. The calculation time for one time step is
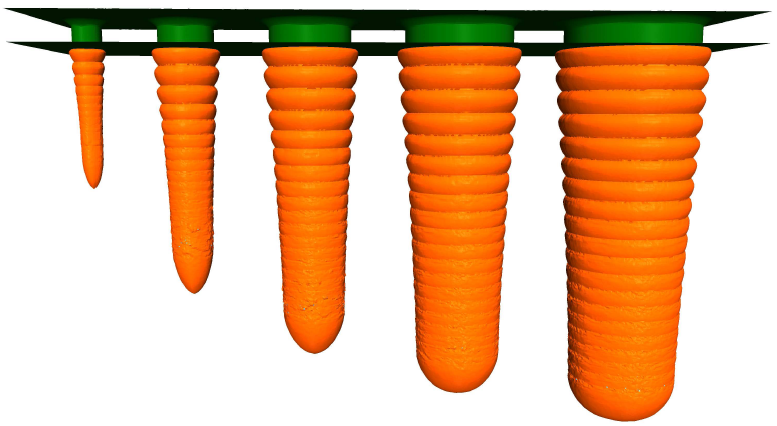
![]() on average. The runtimes increase continuously during the entire simulation due to the increasing depths of the holes and the increasing surface area. Figure 6.10 shows the final profile after 20 cycles. The different etching depths due to the lag effect can be observed. With increasing aspect ratio, the effective etching rate decreases.
on average. The runtimes increase continuously during the entire simulation due to the increasing depths of the holes and the increasing surface area. Figure 6.10 shows the final profile after 20 cycles. The different etching depths due to the lag effect can be observed. With increasing aspect ratio, the effective etching rate decreases.
|
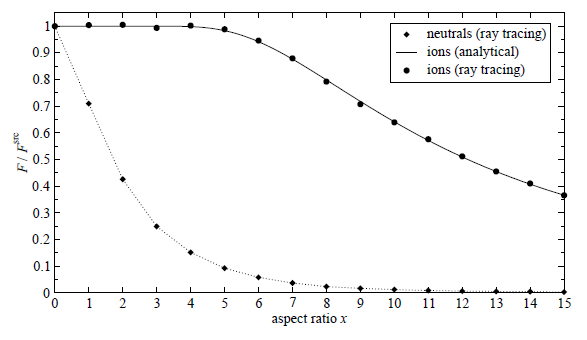
To analyze the reason behind the lag effect in more detail, the ion and neutral fluxes are calculated at the bottom center of idealized cylindrical holes for various aspect ratios ![]() , which is a ratio of the depth and the hole diameter. The ion fluxes obtained by ray tracing are in very good agreement with those calculated analytically (Figure 6.11). The analytical expression
, which is a ratio of the depth and the hole diameter. The ion fluxes obtained by ray tracing are in very good agreement with those calculated analytically (Figure 6.11). The analytical expression
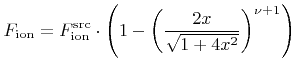 |
(6.5) |
|
According to (6.4) and Table 6.1 the neutral flux is the main contributor to the deposition rate of the passivation layer. Hence, by increasing the aspect ratio, the thickness of the deposited passivation layer decreases due to the smaller neutral fluxes. However, unlike the neutral flux, the ion flux is not reduced significantly. As a consequence, the passivation layer is etched through much faster. The ion flux countervails the lag effect, because the substrate is attacked earlier in the etching cycle for larger aspect ratios. However, this head start is more than compensated by the larger substrate etch rate for smaller aspect ratios, due to the larger neutral fluxes.