For a given electron concentration, a MAXWELLian distribution is uniquely
characterized by the electron temperature. In a semiconductor device, however, the carrier
temperature is no longer sufficient to characterize the distribution function uniquely [65].
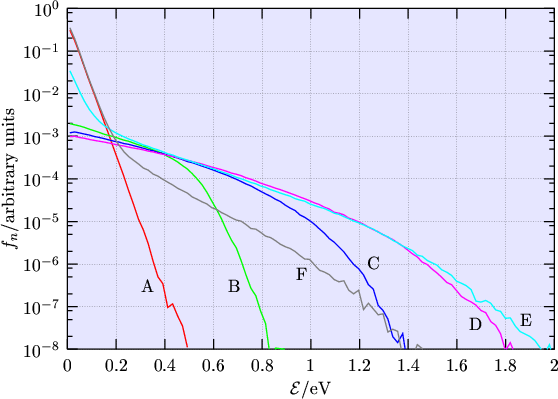
Fig. 5.5 and Fig. 5.6 show the mean electron energy
together with the electron distribution functions inside a channel of a MOS
transistor. Points B, C, D are in the channel while the points E and F are located in the
drain region. In the drain region, the formation of a high-energy tail is obvious, whereas in
the channel a significant thermal tail is observed. This high energy tail does not only
represent some memory of the initial distribution at the injection boundary due to ballistic
transport, but is also affected by electron-phonon interaction [66]. When hot
carriers from the channel of a MOSFET enter the drain region, they mix with the
large pool of cold carriers [67].
Figure 5.5:
Temperature from the mean electron energy along the channel of a MOS
transistor. Six characteristic points are marked for later reference.
|
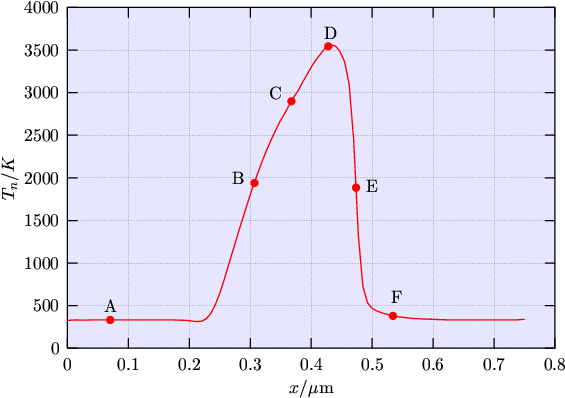 |
Figure 5.6:
Electron distribution function at six characteristics points along the channel of a
MOS transistor. Note that the average energies for the points B and E
are the same.
|
 |
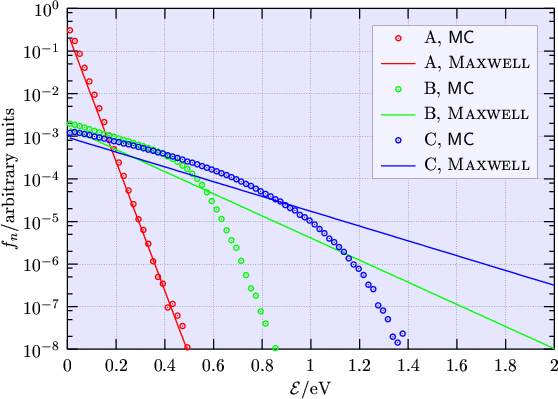
An approximation of the distribution function by a MAXWELL distribution function at the six points from
Fig. 5.6 is depicted in Fig. 5.7. Inside the
channel the number of hot electrons is dramatically overestimated because the
MAXWELL distribution cannot reproduce the thermal tail. Inside the drain region, a
cold and a hot population are visible, which cannot be resolved with a single
MAXWELL distribution.
Figure 5.7:
The distribution function at six characteristic points approximated by a MAXWELL
distribution. Except for the contact regions the distribution function is never anything like a
MAXWELLian.
|
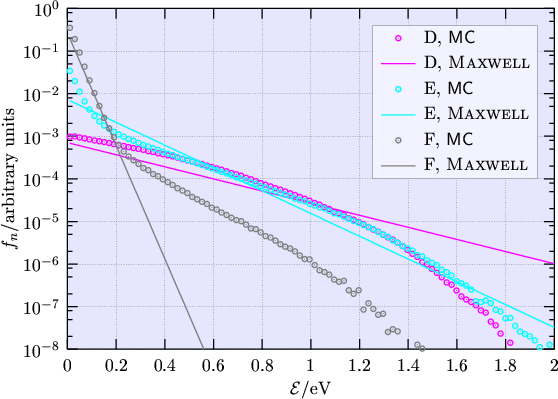 |
Fig. 5.8 displays the qualitative shape of the distribution function in four characteristic
regions. Region I shows the electrons entering the channel where they are accelerated and
gain energy (Region II). In Region III the electrons mix with the pool of cold electrons in
the drain and Region IV shows the cooling of the high energy tail [68, G4].
Figure 5.8:
The shape of the distribution function in four characteristic regions. (Picture gratefully taken
from [69] with kind permission from the author.)
|
![\includegraphics[width=1.\textwidth]{eps/Tibor_df_Artwork}](img952.png) |
M. Gritsch: Numerical Modeling of Silicon-on-Insulator MOSFETs PDF