|
|
|
|
Previous: 6.3 Summarizing the Models Up: 6. Modeling and Application Next: 6.5 "Well-Tempered" SOI MOSFET |
|
|
|
|
Previous: 6.3 Summarizing the Models Up: 6. Modeling and Application Next: 6.5 "Well-Tempered" SOI MOSFET |
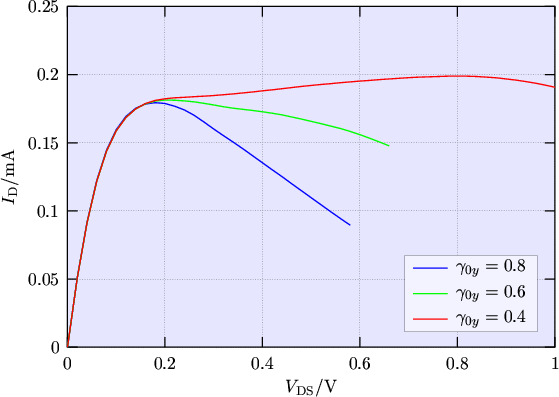 |
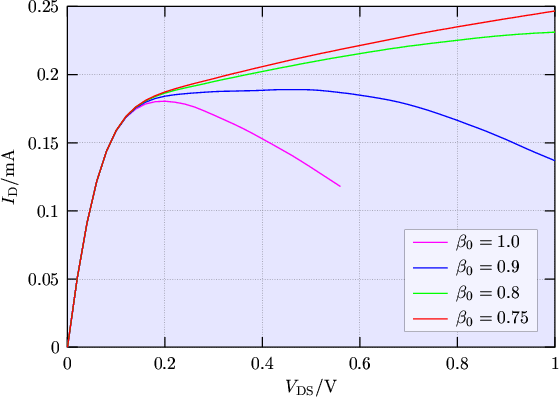
By combining the modifications for an anisotropic temperature and a non-MAXWELLian
closure relation the artificial current decrease is eliminated
(Fig. 6.11). Parameter values roughly estimated from MC simulations can
be used, for example
![]() and
and
![]() . In the parameter range where the
current drop is eliminated the output characteristics are found to be rather insensitive to
the exact parameter values.
. In the parameter range where the
current drop is eliminated the output characteristics are found to be rather insensitive to
the exact parameter values.
 |
When the modified model is applied to a body-contacted MOSFET, the difference in the
output characteristic is only marginal compared to the standard energy transport model. For example
using the values
![]() and
and
![]() leads to a maximum deviation in the
drain current of about
leads to a maximum deviation in the
drain current of about ![]() compared to the standard energy transport model within the bias range.
compared to the standard energy transport model within the bias range.
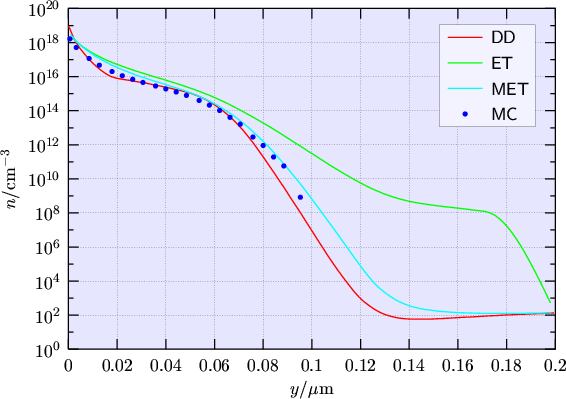
Using the modified energy transport model good agreement of the electron concentration in vertical direction with Monte Carlo data is obtained (Fig. 6.12 and Fig. 6.13). This confirms that the correction of the SOI output characteristics obtained with the modified model is based on a corrected behavior of the electron distribution in the bulk.
![\includegraphics[width=.6\textwidth]{eps/2D_eleMCMET_rot}](img1100.png) |
 |
|
|
|
|
Previous: 6.3 Summarizing the Models Up: 6. Modeling and Application Next: 6.5 "Well-Tempered" SOI MOSFET |