 versus
  versus
 Based on the determination of  ,
,  ,
,  , and
, and  , the change of
  obtained from the measurement-stress-measurement (MSM) routine will now be
compared to the change of
obtained from the measurement-stress-measurement (MSM) routine will now be
compared to the change of  obtained from the on-the-fly (OTF) method.
The results provide valuable information on the applicability of these two
measurement routines and furthermore give new insights into the yet not too well
known dynamics of the contributing defect states.
obtained from the on-the-fly (OTF) method.
The results provide valuable information on the applicability of these two
measurement routines and furthermore give new insights into the yet not too well
known dynamics of the contributing defect states.
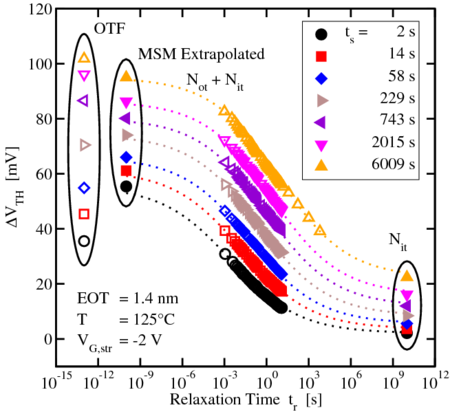
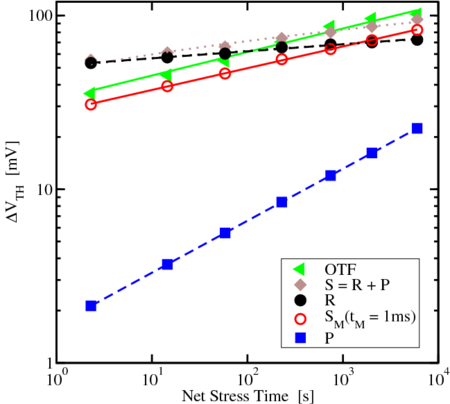
 on top of a
permanent/slowly relaxing component
on top of a
permanent/slowly relaxing component  , their sum
  , and the pure MSM
data evaluated with a delay of
, and the pure MSM
data evaluated with a delay of  are extracted from the left figure
as a function of the stress time. The overall degradation of
are extracted from the left figure
as a function of the stress time. The overall degradation of  does
only qualitatively agree with the OTF1 data points.
does
only qualitatively agree with the OTF1 data points.
By using the universality (cf. Section 4.1) [61, 30], the full degradation of an
MSM-stressed device is reconstructed in Fig. 4.11 and Fig. 4.12. Unfortunately,
the extrapolated initial values right after stress do not match the degradation
gained by the OTF1-method. To explain the differences, the numerical device
simulator MINIMOS-NT [89] is used. Applying the drift-diffusion transport
model after [90], Boltzmann statistics for the carrier concentrations [10],
Shockley–Read–Hall (SRH) interface state dynamics after [91], and mobility
variation due to interface state Coulomb scattering [92], a well defined number of
defects ( and
and  ) is placed at the interface of a pMOS as used in [17]. The
simulated
) is placed at the interface of a pMOS as used in [17]. The
simulated  is then post-processed the same way, as already done by the
MSM-setup and finally converted to
is then post-processed the same way, as already done by the
MSM-setup and finally converted to  . By using definition (1.1) of
 , a parametric relationship between
  and
the resulting charge caused by defects is obtained [39]. The occupancy of the
interface states
and
the resulting charge caused by defects is obtained [39]. The occupancy of the
interface states  determines the detectable charges following the relation
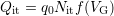 , where
  results in a change of the subthreshold-slope.
This finally affects the calculated
results in a change of the subthreshold-slope.
This finally affects the calculated  , as already indicated in Fig. 2.7 and
Fig. 2.8.
, as already indicated in Fig. 2.7 and
Fig. 2.8.
Simulating the MSM-sequence, shown in Fig. 4.13, yields excellent agreement
when mobility changes during stress are neglected. However, many publications
have emphasized that mobility variations impact the accuracy of the
OTF-method [35, 41]. Simulations performed in [39] showed that an estimated
error of  in the effective mobility results in a spurious shift in
  of about
 4.
The error in
4.
The error in  obtained after an MSM-simulation is roughly
  for the
same device which denotes only a tenth of the simulated
for the
same device which denotes only a tenth of the simulated  -shift. Grasser et
al. confirmed these results as being due to the impact of the mobility
variation on the extracted threshold-voltage shift. Obviously this impact
depends on the applied gate voltage. By employing a numerically simulated
-shift. Grasser et
al. confirmed these results as being due to the impact of the mobility
variation on the extracted threshold-voltage shift. Obviously this impact
depends on the applied gate voltage. By employing a numerically simulated
 -characteristics including a
  mobility degradation, they showed
that the impact of the mobility is largest in the linear OTF-regime and only weak
in the subthreshold MSM-regime [39]. Consequently, the determination of
mobility degradation, they showed
that the impact of the mobility is largest in the linear OTF-regime and only weak
in the subthreshold MSM-regime [39]. Consequently, the determination of
 should be carried out with
  safely in the exponential regime of
  to avoid additional mobility effects.
 once including (solid) and once not including (dashed) mobility
variation confirms that the extraction only slightly depends on the mobility.
The maximum error of
once including (solid) and once not including (dashed) mobility
variation confirms that the extraction only slightly depends on the mobility.
The maximum error of  is observed for
  . The dotted lines
are taken from Fig. 4.11.
. The dotted lines
are taken from Fig. 4.11.
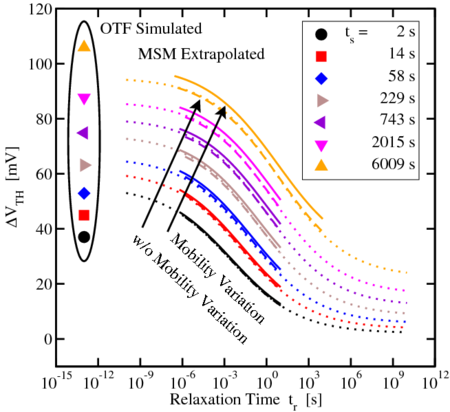
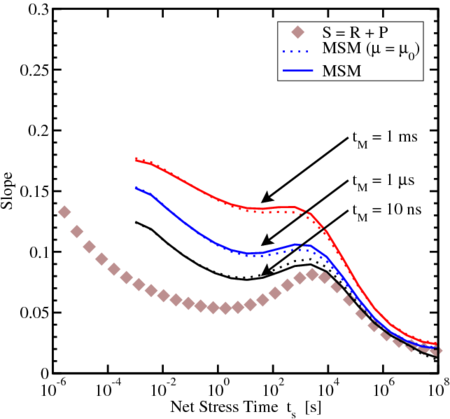
When now the measurement sequences depicted in Fig. 4.11 are re-simulated
with and without a mobility variation of  after
after  stress, as done in
[36], Fig. 4.13 is obtained. The extracted
stress, as done in
[36], Fig. 4.13 is obtained. The extracted  perfectly fits to the expected
values given by
perfectly fits to the expected
values given by  and
and  when mobility changes are neglected, while those
including mobility variation yield a constant shift of
when mobility changes are neglected, while those
including mobility variation yield a constant shift of  with respect to the
real measurement. This is due to the fact that only interface states are
assumed to affect mobility. As these states are considered permanent, only
an upwards shift is obtained in the simulation. Moreover, the influence
of the MSM-measurement delay, which strongly affects the extracted
with respect to the
real measurement. This is due to the fact that only interface states are
assumed to affect mobility. As these states are considered permanent, only
an upwards shift is obtained in the simulation. Moreover, the influence
of the MSM-measurement delay, which strongly affects the extracted
 , is very well described by the simulation results as shown in
Fig. 4.14.
, is very well described by the simulation results as shown in
Fig. 4.14.
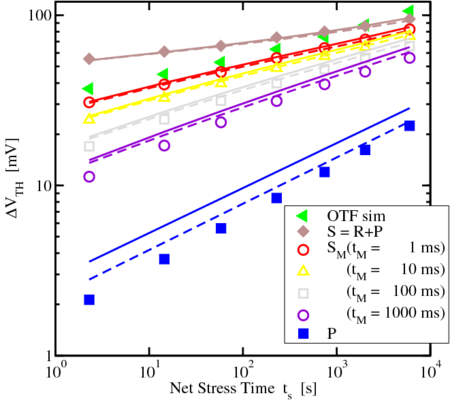
 and
and  components (closed symbols) fit the measurement
data (open symbols). Solid lines are with
components (closed symbols) fit the measurement
data (open symbols). Solid lines are with  mobility degradation while
dashed lines are without. The faster the MSM-sequences are recorded, i.e.
the smaller
mobility degradation while
dashed lines are without. The faster the MSM-sequences are recorded, i.e.
the smaller  , the more
  approaches
  .
.
A much more complex behavior is observed for the extracted degradation
when using OTF methods, since OTF is seriously affected by the shift inherent in
the first data point [40]. The larger the delay, the larger the distortion of the
overall data gets, resulting in a problem similar to that caused by the
MSM time delay, both depicted in Fig. 4.15 and Fig. 4.16. While OTF1
and OTF3 are prone to mobility changes, only OTF2 is uninfluenced by
mobility changes. Only when furthermore presuming a  of at least
  small for the latter OTF2, a match of simulation and measurement is
achieved.
small for the latter OTF2, a match of simulation and measurement is
achieved.
 is.
is.
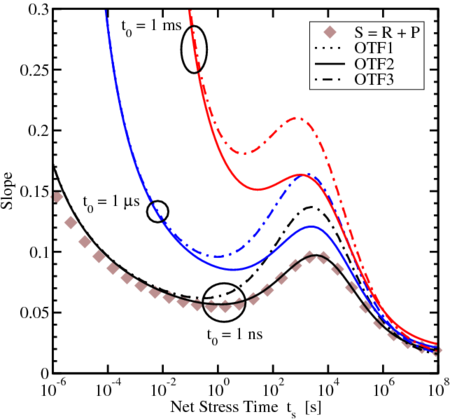
 is able to reproduce the measurement data, while OTF1 and OTF3 are
contaminated by
is able to reproduce the measurement data, while OTF1 and OTF3 are
contaminated by  , the mobility variation, and compact modeling errors
(
, the mobility variation, and compact modeling errors
( , etc.).