7.1 Raw Measurement Results
Though only the very last relaxation curves of the MSM-sequence are depicted
for various oxide electric fields  in Fig. 7.3, with the corresponding
  values obtained from Fig. 7.2, the following similarities of NBTI and PBTI can
be summarized: (i) The
values obtained from Fig. 7.2, the following similarities of NBTI and PBTI can
be summarized: (i) The  -shift is always negative, apparently due to positive
charge build-up during stress. (ii) Up to medium stresses the degradation also
recovers in a similar fashion. (iii) Both NBTI and PBTI show nearly perfect
logarithmic relaxation when stressed up to
-shift is always negative, apparently due to positive
charge build-up during stress. (ii) Up to medium stresses the degradation also
recovers in a similar fashion. (iii) Both NBTI and PBTI show nearly perfect
logarithmic relaxation when stressed up to  for
for  , yielding a
constant recovery rate per decade.
, yielding a
constant recovery rate per decade.
However, there are two main differences between NBTI and PBTI stress and
recovery: (i) The degradation during PBTI stress is about a factor two
smaller than that built up during NBTI. (ii) Deviations are found when
comparing the two cases of low field ( ) versus high field
(
) versus high field
( ), which is emphasized in Fig. 7.3. For NBTI it appears that
the strong relaxation in the initial phase ranging from
), which is emphasized in Fig. 7.3. For NBTI it appears that
the strong relaxation in the initial phase ranging from  to about
  slows down to finally saturate. The saturation level was already defined
as permanent component (in contrast to the recoverable component)
[30, 29]. After [110] this permanent component follows a power-law. In
contrast, for high-field PBTI stress the recovery is first delayed and then
pronounced. The relaxation curve here has an S-shape, which is observed for
the first time, because it is obviously only visible for long relaxation
times.
slows down to finally saturate. The saturation level was already defined
as permanent component (in contrast to the recoverable component)
[30, 29]. After [110] this permanent component follows a power-law. In
contrast, for high-field PBTI stress the recovery is first delayed and then
pronounced. The relaxation curve here has an S-shape, which is observed for
the first time, because it is obviously only visible for long relaxation
times.
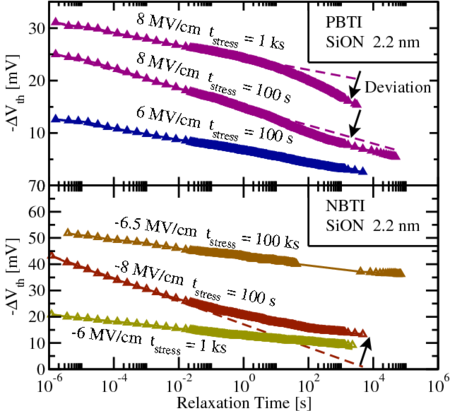
 stressed using
various NBTI/PBTI-conditions from
stressed using
various NBTI/PBTI-conditions from  up to
up to  . Depending on the
type of stress, there is either no deviation from a logarithmic recovery
behavior, a deviation downwards (PBTI) or upwards (NBTI). While
for weak NBTI/PBTI-conditions (
. Depending on the
type of stress, there is either no deviation from a logarithmic recovery
behavior, a deviation downwards (PBTI) or upwards (NBTI). While
for weak NBTI/PBTI-conditions ( and
and  ) a
logarithmic fit of the relaxation is possible, this is not the case for the other
heavier stress conditions.
) a
logarithmic fit of the relaxation is possible, this is not the case for the other
heavier stress conditions.