 at
at  at
at One way to assess the NBTI degradation has been suggested by Kaczer et al.
[17, 18], who switch  close to the threshold voltage
  after stress and at
the same time monitor the degraded and now recovering drain current
after stress and at
the same time monitor the degraded and now recovering drain current  over time. By approximating the initial and the degraded
  -curve
with quadratic polynomials and assuming that the degradation does not
change the form of the initial polynomial approximation, one obtains
-curve
with quadratic polynomials and assuming that the degradation does not
change the form of the initial polynomial approximation, one obtains
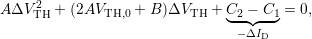 | (2.3) |
and solving the quadratic form of  leads to
 | (2.4) |
Using (2.1) and adding  on both sides yields
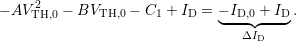 | (2.5) |
Inserting (2.5) into (2.4) finally gives a formula which only depends on  and
and  . The
. The  -shift to the right, respectively the decreasing
  is
displayed in Fig. 2.1.
is
displayed in Fig. 2.1.
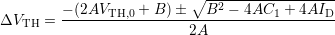 | (2.6) |
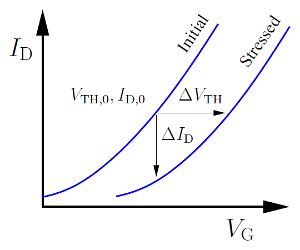
 -curve before and after stress.
The resulting degradation is usually given in terms of
-curve before and after stress.
The resulting degradation is usually given in terms of  or
or  .
.
This measurement method is generally performed using standard off-the-shelf
instruments. Due to the fact that this equipment is not targeted for time-critical
measurements, the shortest achievable measurement delays  only reach down
to about
only reach down
to about  .
.
