 -characteristics-characteristics
Kerber et al. [19] were the first to circumvent the problem of slow response times
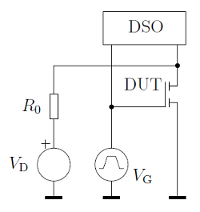
by developing the fast pulsed  -method shown in Fig. 2.4. They adapted
the MSM-technique and used a digital storage oscilloscope (DSO) to
quickly measure the voltages and currents of the device under test (DUT)
and a programmable pulse-pattern generator. The basic principle of the
fast pulsed
-method shown in Fig. 2.4. They adapted
the MSM-technique and used a digital storage oscilloscope (DSO) to
quickly measure the voltages and currents of the device under test (DUT)
and a programmable pulse-pattern generator. The basic principle of the
fast pulsed  -method is depicted in Fig. 2.5 for NBTI (top) and
PBTI (bottom) and works as follows: During initialization, stress or
relaxation,
-method is depicted in Fig. 2.5 for NBTI (top) and
PBTI (bottom) and works as follows: During initialization, stress or
relaxation,  is set to the corresponding constant values
  ,
,  or
or
 . The pulse generator triggers the fast
  -measurement by
sending a gate-pulse reaching from accumulation to inversion when in
relaxation-mode, respectively from inversion to accumulation when in
stress-mode.
-measurement by
sending a gate-pulse reaching from accumulation to inversion when in
relaxation-mode, respectively from inversion to accumulation when in
stress-mode.
 and
and  . Since
the digital storage oscilloscope (DSO) can not measure
. Since
the digital storage oscilloscope (DSO) can not measure  directly,
 is calculated via the voltage drop across
  to finally obtain the
 -characteristic. The corresponding triangular
  -pulses shown in
Fig. 2.5 are supplied by the pulse generator.
-pulses shown in
Fig. 2.5 are supplied by the pulse generator.
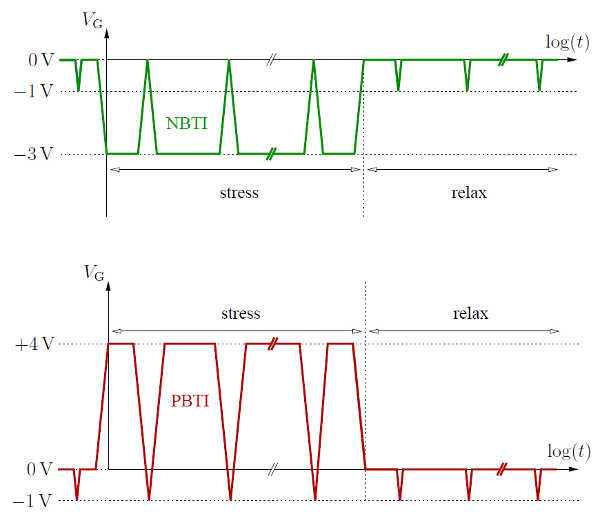
 -characteristics are performed via
a superposition of a constant gate level (stress or relaxation) with triangular
gate pulses. Switching from the requested NBTI stress of
-characteristics are performed via
a superposition of a constant gate level (stress or relaxation) with triangular
gate pulses. Switching from the requested NBTI stress of  into the
measurement mode ranging from
into the
measurement mode ranging from  to
to  should be carried out as
fast as possible in order to avoid undesired relaxation defects. Bottom: The
same sequence for a PBTI stress of
should be carried out as
fast as possible in order to avoid undesired relaxation defects. Bottom: The
same sequence for a PBTI stress of  .
.
Since the DSO can only measure voltages, the actual drain current is
calculated via the voltage drop across  (Fig. 2.4), assuming
  small
enough so that the transistor stays in the ohmic region.
small
enough so that the transistor stays in the ohmic region.
With standard equipment, pulse times between  [19],
[19],  [20, 21, 22, 23, 24, 25], down to
  [26] can be achieved. The form of used
pulses varies from trapezoidal [19, 21, 26], over rectangular with only very
small rise and fall times compared to the pulse width itself [21], up to
triangular [20, 21, 22, 24, 25]. By varying the rise and fall times of the
pulses the trapping and detrapping kinetics can be analyzed [21]. To avoid
spurious hystereses (parasitic capacitances) in the
[26] can be achieved. The form of used
pulses varies from trapezoidal [19, 21, 26], over rectangular with only very
small rise and fall times compared to the pulse width itself [21], up to
triangular [20, 21, 22, 24, 25]. By varying the rise and fall times of the
pulses the trapping and detrapping kinetics can be analyzed [21]. To avoid
spurious hystereses (parasitic capacitances) in the  -characteristics
between the rising and falling edges of the pulses, the cable length has to be
adjusted in order to ensure the synchronized signal transmission to the DSO
[25, 20].
-characteristics
between the rising and falling edges of the pulses, the cable length has to be
adjusted in order to ensure the synchronized signal transmission to the DSO
[25, 20].
The major issue with this method is that the gain in speed is partly
consumed by the fact that the resolution of the DSO is too limited for real
‘single’-pulse-measurements [12]. After the necessary averaging of a few
( ) pulses, the measurement time increases by the averaging factor.
Furthermore, the synchronization between the pulse-pattern generator and the
DSO turns out to be tricky.
) pulses, the measurement time increases by the averaging factor.
Furthermore, the synchronization between the pulse-pattern generator and the
DSO turns out to be tricky.