Next: 6. Conclusions Up: 5.3 Applied Optimized Parameters Previous: 5.3.1 Thermal Analysis of Contents
If larger and more complex interconnect structures have to be investigated, the required detail level as presented in the previous example might exhaust the available computational capabilities in terms of memory and CPU power. Therefore, appropriately simplified models are used to analyze complex structures as presented for instance in Figure 2.3 to obtain a rough overview. However, the critical regions have to be extracted and recalculated at a higher detail level. Using successfully extracted material parameters provides a good insight into the transient device behavior -- even with simplified material models.
In this example the electro-thermal simulation with STAP [39] is used to produce the appropriate input data necessary for the thermo-mechanical simulation using the finite element simulator FEDOS [345,36]. The simulation setup is quite similar to the one in the previous example. A bias is applied between two lines, which are connected through a via. A heat sink is attached at the bottom of the interconnect stack to keep the temperature at 320 K. At the other thermal boundaries, homogeneous NEUMANN conditions are applied. The simulations have been carried out with the simplified material model to obtain simulation results within reasonable time because the simulation is separated into two parts: the electro-thermal and the thermo-mechanical simulation.
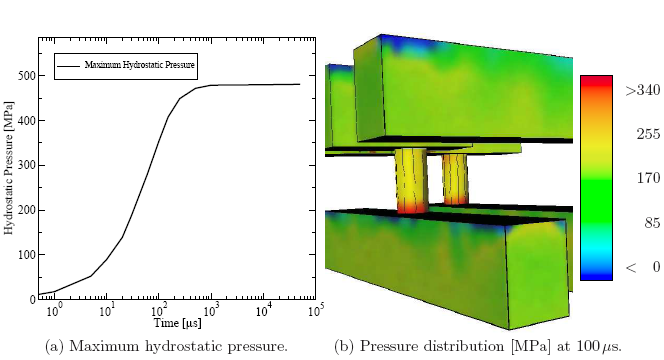
The result of these simulations is at the first level the temperature distribution (cf. Figure 5.22), which is a required part of the input data of the thermo-mechanical simulator FEDOS. As a final result the hydrostatic pressure (cf. Figure 5.23) is obtained as the trace of the mechanical stress tensor. Figure 5.22a and Figure 5.23a show the evolution of the maximum temperature and pressure, respectively. In addition, typical distributions of the quantities are shown in Figure 5.22b and Figure 5.23b. This type of information can be used as representative quantities for design rule checks and for further optimization of the reliability of interconnect structures.
 |
 |