3.3 Thermal Conductivity

According to FOURIER's law (e.g. to Chapter 2) the heat flow between two regions having different temperatures is determined by the temperature gradient and a proportional factor $ \lambda$ . The value of the thermal conductivity for metals is related to the electrical conductivity because the electron gas in the metal transports the heat as well as the electrical current. 
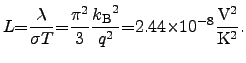
WIEDEMANN and FRANZ found that the ratio between the electrical and thermal conductivity for a metal is proportional to the absolute temperature

$\displaystyle \lambda {=}L \sigma   T,$ (3.16)

Later on, this proportionality factor $ L$ was identified by LORENZ as

$\displaystyle L {=}\frac{\lambda}{\sigma T} {=}\frac{\pi^2}{3}\frac{{k_{\mathrm{B}}}^2}{q^2} {=}2.44{\times}10^{-8}  \mathrm{\frac{V^2}{K^2}}.$ (3.17)

Equation (3.16) is referred to as the WIEDEMANN-FRANZ-LORENZ law and considers only the contribution of the heat transport capabilities of the electrons. Due to the different material properties, each material has its own LORENZ number, which differs from the theoretical value and generally depends on the temperature.

Table 3.3: Typical values for the thermal conductivities of various materials.
Material $ \lambda$ [W/K] References
Si Nanowires $ 4.0 - 4.6 \times10^{4}$ [77,78]
Diamond $ 1.0 - 2.5 \times10^{3}$ [79]
Cu $ 3.80-4.13{\times}10^{2} (300  \mathrm{K})$ [191,39]
  $ 3.63-3.92{\times}10^{2} (400  \mathrm{K})$ [191,39]
  $ 3.55-3.86{\times}10^{2} (500  \mathrm{K})$ [191,39]
  $ 3.49-3.79{\times}10^{2} (600  \mathrm{K})$ [191,39]
Al $ 2.37{\times}10^{2} (300  \mathrm{K})$ [33]
  $ 2.40{\times}10^{2} (400  \mathrm{K})$ [33]
  $ 2.37{\times}10^{2} (500  \mathrm{K})$ [33]
  $ 2.32{\times}10^{2} (600  \mathrm{K})$ [33]
n-polySi $ 0.16-0.41{\times}10^{2}$ [192,193,194,80,195]
p-polySi $ 0.17-0.20{\times}10^{2}$ [194]
Si $ 2.66{\times}10^{2} (200  \mathrm{K})$ [79,136]
  $ 1.56{\times}10^{2} (300  \mathrm{K})$ [79,136]
  $ 1.05{\times}10^{2} (400  \mathrm{K})$ [79,136]
  $ 0.80{\times}10^{2} (500  \mathrm{K})$ [79,136]
Ge $ 0.95{\times}10^{2} (200  \mathrm{K})$ [79,136]
  $ 0.60{\times}10^{2} (300  \mathrm{K})$ [79,136]
  $ 0.44{\times}10^{2} (400  \mathrm{K})$ [79,136]
  $ 0.33{\times}10^{2} (500  \mathrm{K})$ [79,136]
GaAs $ 0.44{\times}10^{2}$ [79]
$ {\mathrm{Al_2O_3}}$ $ 0.21$ [25]
$ \mathrm{SiO_2}$ $ 0.014$ [25]

Nevertheless, (3.17) is a very good approximation for metals at temperatures above the DEBYE3.3 temperature $ {\Theta_{\mathrm{D}}}$  [142]. Better agreement with measurements can be obtained using an adjusted model

$\displaystyle \lambda(T) {=}\lambda_0 + L \sigma  T,$ (3.18)

where the term $ \lambda_0$ can even be of the same order of magnitude as the WIEDEMANN-FRANZ-LORENZ term. For temperatures below $ {\Theta_{\mathrm{D}}}$ , a second-order term might have to be included, according to the model

$\displaystyle \lambda(T) {=}\lambda_0 + L \sigma  T + \beta_{\mathrm{\lambda}}  T^2,$ (3.19)

where for temperatures below the DEBYE temperature $ {\Theta_{\mathrm{D}}}$ the parameter $ \lambda_0$ is often negligible. Another approach to describe both temperature regimes is to use an empirical polynomial model of second order

$\displaystyle \lambda(T) {=}\frac{\lambda_0}{1+\alpha_{\lambda} (T-T_0)+\beta_{\lambda}(T-T_0)^2}$ (3.20)

which is a TAYLOR series for the thermal resisitivity $ 1/\lambda_0$ at the reference temperature $ T_0$ . Here, $ \lambda_0$ is the thermal conductivity at the reference temperature $ T_0$ and the coefficients $ \alpha_{\lambda}$ and $ \beta_{\lambda}$ are the corresponding first- and second-order temperature coefficients.

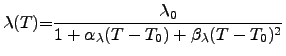
As a first approach the thermal conductivity can be assumed to follow the WIEDEMANN-FRANZ-LORENZ law, also for nonmetalic materials. However, to improve the model accuracy for semiconducting and insulating materials, a polynomial model may be used. A comparison of typical values of the thermal conductivities of common materials is given in Tab. 3.3 and Figure 2.9, where Tab. 3.3 shows a list of common materials ordered by descending thermal conductivities and Figure 2.9 gives an overview of the temperature dependence of various materials compared to Si and Ge.


Stefan Holzer 2007-11-19