The ballistic transmission function is directly related to the product of the density of phonon states and phonon group velocity. Below, each of these quantities and their geometry dependence is investigated in order to provide insight into the orientation dependence of the thermal conductance. For this, nanowires with
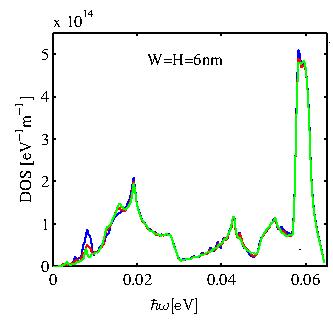
![]() in the three different orientations are considered. Figure 4.4 shows the phonon density of states, which is nearly the same for all orientations in the entire range of frequencies. This can be understood by considering the fact that the density of states is mostly related to the density of atoms in the cross section of the nanowires. The density of atoms is mostly a bulk property and does not change drastically in silicon-based structures. Each atom has three degrees of freedom (
in the three different orientations are considered. Figure 4.4 shows the phonon density of states, which is nearly the same for all orientations in the entire range of frequencies. This can be understood by considering the fact that the density of states is mostly related to the density of atoms in the cross section of the nanowires. The density of atoms is mostly a bulk property and does not change drastically in silicon-based structures. Each atom has three degrees of freedom ( ![]() elements in its dynamic matrix component), and therefore provides three eigenmodes. Although for ultra-narrow structures i.e. of
elements in its dynamic matrix component), and therefore provides three eigenmodes. Although for ultra-narrow structures i.e. of
![]() there could be some differences in the density of states due to finite size effects, a
there could be some differences in the density of states due to finite size effects, a
![]() structure is large enough such that the density of states is orientation independent.
structure is large enough such that the density of states is orientation independent.
|
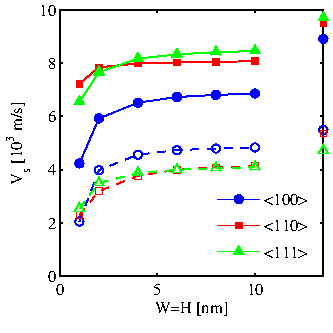
On the other hand, as shown in Fig. 4.5, the sound velocity, defined by the slope of
the acoustic modes near the Brillouin zone center, is a non-isotropic quantity. The two lowest modes in the phonon dispersion of nanowires are flexural modes. The third mode is the one used to calculate the transverse sound velocity, whereas the fourth mode gives the longitudinal sound velocity. The results, as shown in Fig. 4.5, are in good agreement with previous studies on nanowire sound velocities [39,108]. The
![]() nanowire has the highest longitudinal sound velocity (green-solid), whereas the
nanowire has the highest longitudinal sound velocity (green-solid), whereas the
![]() nanowire the lowest for all cross section sizes. The transverse velocities are lower, and in that case, the
nanowire the lowest for all cross section sizes. The transverse velocities are lower, and in that case, the
![]() nanowire has the highest velocity. The values calculated here are different, and in general lower than the bulk sound velocities (Symbols at the right axis of Fig. 4.5). The velocities in nanowires are lower, also in agreement with other reports, since confinement flattens the phonon spectrum and reduces sound velocities [109].
nanowire has the highest velocity. The values calculated here are different, and in general lower than the bulk sound velocities (Symbols at the right axis of Fig. 4.5). The velocities in nanowires are lower, also in agreement with other reports, since confinement flattens the phonon spectrum and reduces sound velocities [109].
|
At first, following a bulk way of analysis, it seems that according to the ordering in the sound velocity one would expect that the thermal conductance should be higher in the
![]() nanowires, followed by the
nanowires, followed by the
![]() nanowires and then by the
nanowires and then by the
![]() nanowires. As we show in Fig. 4.3, however, the order is different, namely that the
nanowires. As we show in Fig. 4.3, however, the order is different, namely that the
![]() nanowires have the highest thermal conductance, followed by the
nanowires have the highest thermal conductance, followed by the
![]() , and then by the
, and then by the
![]() nanowires. The reason is that the phonon dispersion is modified in nanostructures so that the bulk definition of acoustic and optical modes is no longer the relevant quantity. The sound velocity determines the dispersion only in a small part of energy spectrum (
nanowires. The reason is that the phonon dispersion is modified in nanostructures so that the bulk definition of acoustic and optical modes is no longer the relevant quantity. The sound velocity determines the dispersion only in a small part of energy spectrum (
![]() of out of the total
of out of the total
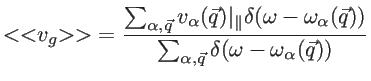
![]() ). In addition, at room temperature, all the phonons in the entire energy spectrum contribute to the thermal conduction. Therefore, the sound velocity alone cannot describe the nanowire phonon spectrum, which is an indication that the bulk treatment is insufficient for understanding thermal transport in nanowires. What needs to be taken into consideration in order to correctly interpret the results, therefore, is the group velocity of all phonon modes at all energies. For this, we define the average group velocity
as follows:
). In addition, at room temperature, all the phonons in the entire energy spectrum contribute to the thermal conduction. Therefore, the sound velocity alone cannot describe the nanowire phonon spectrum, which is an indication that the bulk treatment is insufficient for understanding thermal transport in nanowires. What needs to be taken into consideration in order to correctly interpret the results, therefore, is the group velocity of all phonon modes at all energies. For this, we define the average group velocity
as follows:
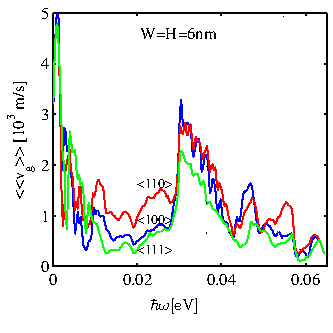
In contrast to the sound velocity, the average weighted group velocity over
different modes can provide a better and more correct insight with regards to phonon
transport. Figure 4.6 shows that the average group velocity of phonons for the
![]() nanowires is the highest compared to the other orientations in the largest part of the energy spectrum. This can be explained by the shape of the dispersions shown in Fig. 4.1. In the case of the
nanowires is the highest compared to the other orientations in the largest part of the energy spectrum. This can be explained by the shape of the dispersions shown in Fig. 4.1. In the case of the
![]() nanowire, the modes look overall less dispersive, i.e. have less curvature. This results in the lowest average group velocity. The modes of the
nanowire, the modes look overall less dispersive, i.e. have less curvature. This results in the lowest average group velocity. The modes of the
![]() nanowire, on the other hand, are more dispersive, i.e. have more curvature, which results in the highest group velocity. By considering that all nanowires with the same cross sectional area have the same phonon density of states, the differences in the group velocity explain the orientation-dependence observed in the transmission functions and in the thermal conductance shown in Fig. 4.2 and Fig. 4.3, respectively. The transmission function of the
nanowire, on the other hand, are more dispersive, i.e. have more curvature, which results in the highest group velocity. By considering that all nanowires with the same cross sectional area have the same phonon density of states, the differences in the group velocity explain the orientation-dependence observed in the transmission functions and in the thermal conductance shown in Fig. 4.2 and Fig. 4.3, respectively. The transmission function of the
![]() nanowire is
nanowire is
![]() lower than that of the
lower than that of the
![]() nanowires and almost
nanowires and almost
![]() lower than that of the
lower than that of the
![]() nanowires.
nanowires.
|