|
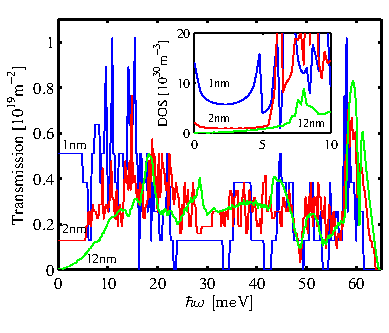
Figure. 5.1 depicts the transmission function per unit area as a function of frequency for
![]() nanowires of diameters
nanowires of diameters
![]() ,
,
![]() , and
, and
![]() . The inset of Fig. 5.1 shows the density of states per unit volume of these nanowires versus frequency. Note that we use the
. The inset of Fig. 5.1 shows the density of states per unit volume of these nanowires versus frequency. Note that we use the
![]() transport orientation throughout this chapter. The basic features we describe, however, are valid for different orientations as well. The transmission of the
transport orientation throughout this chapter. The basic features we describe, however, are valid for different orientations as well. The transmission of the
![]() nanowire as well as the DOS follow the
nanowire as well as the DOS follow the ![]() relation of bulk at low frequencies. For thinner diameters, however, the transmission and DOS are constant at low frequencies, and increase as the diameter is reduced. The fact that there is a constant transmission at
relation of bulk at low frequencies. For thinner diameters, however, the transmission and DOS are constant at low frequencies, and increase as the diameter is reduced. The fact that there is a constant transmission at ![]() for the acoustic branches leads to a strong manifestation of the long-wavelength problem in the thermal conductivity as we will see below.
for the acoustic branches leads to a strong manifestation of the long-wavelength problem in the thermal conductivity as we will see below.