


Next: 7.2 Development
Up: 7.1 Bake Steps
Previous: 7.1.1 Prebake
7.1.2 Post-Exposure Bake
Depending on the resist system post-exposure bakes are performed
to reduce standing wave
effects or to thermally catalyze chemical reactions amplifying the latent bulk
image. The former phenomenon is usually exploited in case of conventional
DQN resists, whereas the latter forms the basis of chemically amplified resists.
The following two models are suitable for one of the two resist systems.
Conventional resists.
Many attempts have been made to reduce the vertically non-uniform exposure
pattern that is caused by substrate reflections and leads to standing waves
within the resist. One particularly useful method is a post-exposure or
pre-development bake first proposed by Edward Walker [76].
Both linewidth control and resolution are thereby significantly increased.
The utilized physical phenomenon can be explained as the diffusion
of the PAC within the film during the high temperature bake. Typical bake
temperatures are about 100oC, and bake times
tpeb range
around 10 minutes in an oven.
For the modeling it usually suffices to assume a concentration independent
diffusion coefficient
Dpeb. This simple situation is called
Fickean diffusion since the distribution of the PAC
m(x;t)
is governed by Fick's second law of diffusion that writes
as [206, p. 71]
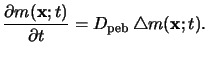 |
(7.8) |
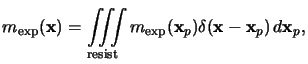
Note that the above law is only valid for a constant diffusion coefficient
Dpeb. The initial conditions are given by the calculated spatial
distribution
mexp(x) after exposure,
i.e., (7.9) has to be solved subject to
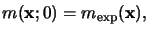 |
(7.9) |
and no out-diffusion of the PAC is assumed across the resist surface, i.e.,
homogeneous Neumann boundary conditions are imposed.
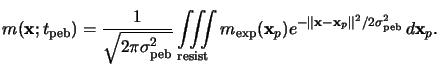
The solution of (7.9) is obtained with the help of the fundamental
solutions
mp(x;t) for an ideal ``unit impulse source'' located at
any position
xp inside the resist. These fundamental solutions
mp(x;t) equal the Gaussian distribution
function [206, p. 71]
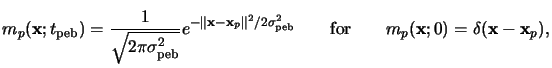 |
(7.10) |
whereby the standard deviation
 is commonly called
diffusion length.
is commonly called
diffusion length.
 is related to the diffusion
coefficient
Dpeb and the bake time
tpeb by
is related to the diffusion
coefficient
Dpeb and the bake time
tpeb by
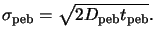 |
(7.11) |
Since the initial distribution
mexp(x) can be
written as superposition of weighted impulses like
 |
(7.12) |
and the integration and differentiation are interchangeable, the
PAC distribution
m(x;tpeb) after the post-exposure bake
can be written as
 |
(7.13) |
This relation equals a convolution of the PAC concentration
mexp(x) right after exposure with the Gaussian
distribution function
mp(x;t) of (7.11), i.e.,
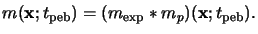 |
(7.14) |
For the numerical evaluation the integrations in (7.14)
are approximated by summations over volume elements
 x,
whereby the grid spacing should be
smaller than three times the diffusion length
x,
whereby the grid spacing should be
smaller than three times the diffusion length
 ,
e.g.,
,
e.g.,
 x
x 3
3 .
.
Only one parameter appears in the Fickean diffusion
model (7.15), namely the diffusion
length
 given in (7.12).
This simple approach is physically limited since the PAC is the
only considered component of the resist and therefore
the reactions between the different resist compounds cannot be taken into
account. However, it is the
common model for the post-exposure bake step in case of
conventional DQN-resists. For example, the widely used
lithography simulators PROLITH [108], SAMPLE [207] and
SOLID-C [106] rely on it.
given in (7.12).
This simple approach is physically limited since the PAC is the
only considered component of the resist and therefore
the reactions between the different resist compounds cannot be taken into
account. However, it is the
common model for the post-exposure bake step in case of
conventional DQN-resists. For example, the widely used
lithography simulators PROLITH [108], SAMPLE [207] and
SOLID-C [106] rely on it.
Chemically amplified resists.
In case of chemically amplified resists the reactions governing the bake effects
have to be considered simultaneously with the diffusion of the involved species.
An extension of the simple considerations presented in
Section 5.1.3 was proposed by Richard
Ferguson [87,88]. In this model two species are considered,
namely reactive sites
m(x;t) not consumed by the acid and the
acid concentration
h(x;t) produced during exposure.
These species are assumed to react as follows:
Firstly, the concentration
m(x;t) is driven by its availability
and the acid concentration
h(x;t) raised to a power n, and,
secondly, the catalyzing acid
h(x;t) decreases with time according
to its concentration because of possible loss mechanism such as neutralization
or time-sharing with the deprotected material. Note that the first reaction
also occurs in the simple model (5.16), whereas the
acid-loss mechanism corresponds to the extension. These two reactions are
completed by a diffusion term for the acid
h(x;t) yielding
two coupled partial differential equations
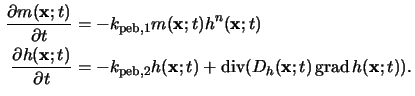 |
|
The reaction order n and the first rate parameter
kpeb, 1
characterize the chemical amplification (cf. (5.18)), whereas
the second rate parameter
kpeb, 2 describes potential loss
mechanisms of the catalyzer.
The diffusion coefficient
Dh(x;t) of the acid depends on the
already reacted, consumed sites
x(x;t) = 1 - m(x;t).
Various models have been proposed to describe this dependence, e.g.,
 |
(7.15) |
The linear relationship reflects possible use of deprotected sites as stepping
stones, and the exponential dependence accounts for free volume
effects [97]. All resist parameters typically exhibit an Arrhenius-type
temperature behavior.
At the beginning of the bake no sites are activated and
the acid concentration is obtained from the preceding exposure simulation.
The initial conditions for (7.16) are thus given by
 |
(7.16) |
The following boundary conditions are usually imposed:
The resist/substrate interface can be assumed to be impermeable so that no
diffusion occurs across it. At the lateral boundaries either periodic
or homogeneous Neumann conditions are imposed, i.e., in the latter case
a vanishing flux across the lateral boundaries is prescribed. The physically
most important boundary segment is the resist surface, since acid diffusion
into the atmosphere above the wafer occurs. The amount of this acid
evaporation is a function of the acid size and the degree of its interaction
with the resist polymer. A small acid molecule will have significant
evaporation, for large molecules this effect will be negligible. In general,
the evaporation is modeled by
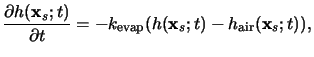 |
(7.17) |
whereby
hair(xs;t) is the acid
concentration in the atmosphere in the vicinity of the resist
surface
xs.
Usually, the post-exposure bake takes place in a reasonable open environment
with enough air flow to eliminate any buildup of evaporated acid above the
resist. Thus
hair(xs;t) can be neglected.
If
kevap is very small, then virtually no evaporation takes place.
On the other hand, if
kevap is very large, the effect is to bring
the acid surface concentration in the resist to zero.
This post-exposure bake model was successfully applied to study bake effects
of various chemically amplified resist systems. Simulation parameters for the
important IBM APEX-E resist are summarized in
Table 7.1.
A similar model was also used for a popular negative acid-hardening
resist [86].
Table 7.1:
Post-exposure bake parameters at 90oC for the
IBM APEX-E chemically amplified resist.
| Parameter |
Equation |
Value |
Unit |
Ref. |
| A |
(5.8) |
-0.001 |
1/
 m m |
[93] |
| B |
(5.8) |
0.37 |
1/
 m m |
[93] |
| C |
(5.15) |
0.0042 |
cm2/mJ |
[93] |
|
kpeb, 1 |
(7.16) |
2.0 |
1/s |
[97] |
|
kpeb, 2 |
(7.16) |
0.0033 |
1/s |
[97] |
| n |
(7.16) |
1.8 |
-- |
[97] |
| Dh, 0 |
(7.17) |
0.0933 |
nm2/s |
[97] |
| wh |
(7.17) |
5.8 |
-- |
[97] |
|
Next: 7.2 Development
Up: 7.1 Bake Steps
Previous: 7.1.1 Prebake
Heinrich Kirchauer, Institute for Microelectronics, TU Vienna
1998-04-17