Next: 5. Charge Injection Models
Up: 4. Doping and Trapping
Previous: 4.3 Doping Characteristics
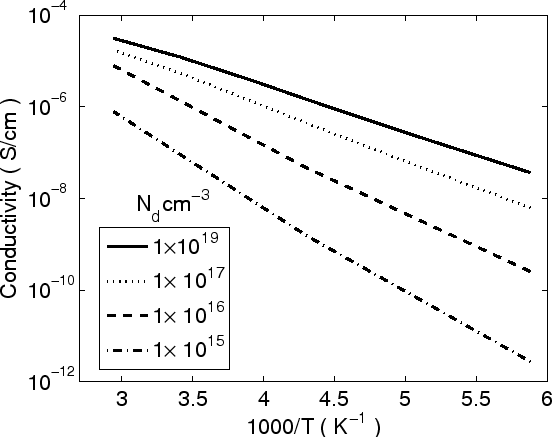
Fig 4.9 and 4.10 illustrate the temperature dependence of the carrier conductivity for
different trap concentrations. The
parameters are
 cm
cm ,
,  eV,
eV,  K,
K,  K,
K,

 and
and
 S/cm. Despite the
effect of the traps, we can see an almost perfect Arrhenius-type temperature
dependence in Fig 4.9, with the slope affected by the trap concentration.
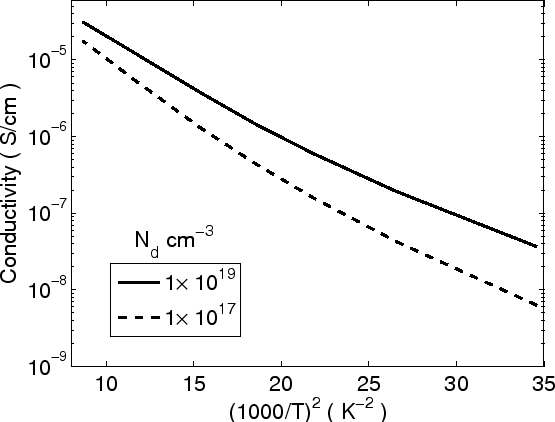
Increasing the latter, the activation energy decreases. In Fig 4.10,
S/cm. Despite the
effect of the traps, we can see an almost perfect Arrhenius-type temperature
dependence in Fig 4.9, with the slope affected by the trap concentration.
Increasing the latter, the activation energy decreases. In Fig 4.10,
 versus
  is plotted
. The deviation from a straight line occurs at higher
temperature, where nearly all carriers occupy the intrinsic states, and the
filled extrinsic trap states do not change the trap-free hopping relation
is plotted
. The deviation from a straight line occurs at higher
temperature, where nearly all carriers occupy the intrinsic states, and the
filled extrinsic trap states do not change the trap-free hopping relation
 [98]. However, at lower temperature, the carrier
distribution will be pinned near the peak of trap DOS [68].
[98]. However, at lower temperature, the carrier
distribution will be pinned near the peak of trap DOS [68].
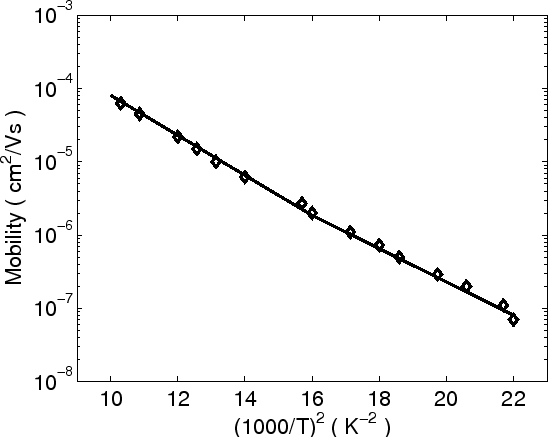
In Fig 4.11 we compare the analytical model with experimental data reported in
[99]. Parameters are the
relative trap concentration
 ,
,
 K, K,
K, K,  eV,
eV,
 and
and
 S/m. The data are for TTA with doping DAT.
The relation between conductivity and  is shown in Fig 4.12. Parameters are
 cm,
cm,
 cm, K,
Figure 4.9:
Conductivity of an organic semiconductor versus  for
different trap concentrations.
for
different trap concentrations.
|
|
Figure 4.10:
Conductivity of an organic semiconductor versus for
different trap concentrations.
|
|
Figure 4.11:
Temperature dependence of the zero-field mobility for TTA doped
with DAT. Symbols represent experimental data from [99].
|
|
Figure 4.12:
Conductivity of an organic semiconductor versus the width of
the trap distribution, .
|
|
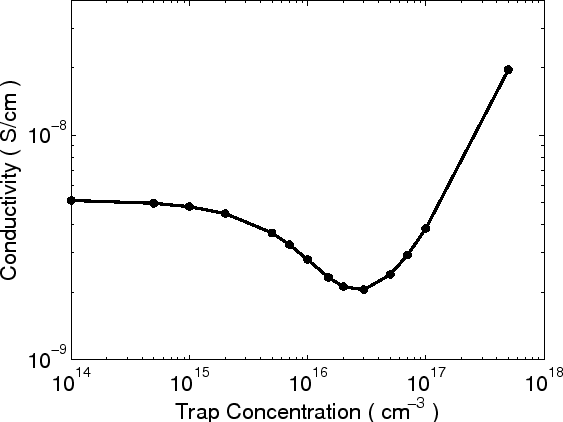
Figure 4.13:
The dependence of the conductivity on the trap concentration.
|
|
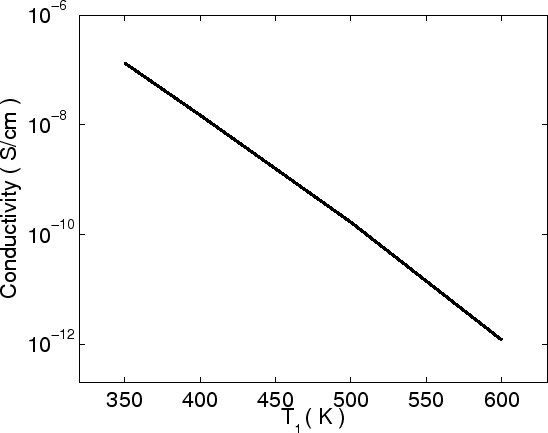
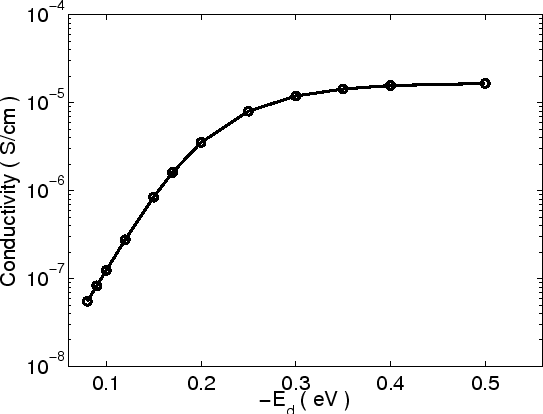
Figure 4.14:
The dependence of the conductivity on the Coulombic trap energy.
|
|
 K,
K,  eV,
eV,
 Åand
Åand
 S/m. For the
exponential DOS function of the traps, the parameter is a
characteristicstic temperature, where
S/m. For the
exponential DOS function of the traps, the parameter is a
characteristicstic temperature, where  represents the
activation energy [100] and defines the width of the distribution
[101]. Fig 4.12 confirms that the conductivity decreases with
almost linearly.
represents the
activation energy [100] and defines the width of the distribution
[101]. Fig 4.12 confirms that the conductivity decreases with
almost linearly.
The relation between conductivity and trap concentration is shown in Fig 4.13. The parameters are
cm,
Å,  K,
K,  K,
K,  eV, the
temperature is
eV, the
temperature is  K and
S/m.
K and
S/m.
At a critical trap concentration the conductivity has a
minimum. This has been verified by experiments
[102] and Monte Carlo simulation [103]. The minimum is due to the onset of
inter-trap transfer that alleviates thermal detrapping of carriers, which is a
necessary step for charge transport [103]. We can also see that a small
trap concentration has virtually no effect on the conductivity. At
higher trap concentration, however, the activation energy for the conductivity decreases. The
traps themselves can serve as an effective
hopping transport band, so the effect of traps on the charge conductivity is
qualitatively similar to that caused by a high carrier concentration. It is
interesting that such transition has also been observed in thermally stimulated
luminescence (TSL) measurements [104].
The relation between the conductivity and the trap
energy  is shown in Fig 4.14. Parameters are
 K,
K,  K,
K,
 cm,
cm,
 cm,
cm,
 Å,
Å,  K and
S/m. From
Fig 4.14 we can conclude that the conductivity increases approximately exponentially for
K and
S/m. From
Fig 4.14 we can conclude that the conductivity increases approximately exponentially for
 below a certain critical value and saturates for larger
.
below a certain critical value and saturates for larger
.
Next: 5. Charge Injection Models
Up: 4. Doping and Trapping
Previous: 4.3 Doping Characteristics
Ling Li: Charge Transport in Organic Semiconductor Materials and Devices