Next: 5.2 Electromigration Reliability of Solder Bumps Up: 5.1 Electromigration Failure in Open TSVs Previous: 5.1.3 Void Growth Analysis
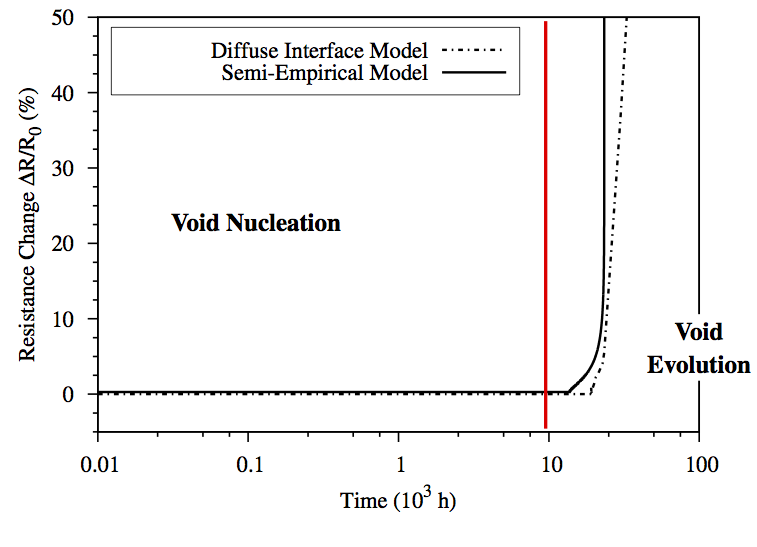
Once both void nucleation tn and void evolution te times are determined, the electromigration failure time evaluation of the open copper TSV structure can be determined. The total electromigration TTF can be expressed as the sum of the void nucleation and the void evolution times. The void nucleation and void evolution times are of about the same order of magnitude. This highlights the importance of including both contributions in the complete electromigration TTF estimation of the given interconnect structure. (5.9) shows the interconnect resistance as a function of time for a given applied current density.
The two curves are obtained by following the two methodologies describing the void evolution mechanism due to electromigration. As expected, the resistance curve can be analyzed by dividing it in two parts. The latency period is characterized by the void nucleation phase. During this period the void is nucleating and any resistance change is electrically undetectable. Therefore, at the beginning, changes in resistance with time are very small. After a void has nucleated, the void evolution phase begins. The resistance of the TSV progressively increases with time. Here, the void is growing and its size influences the electric performance of the interconnect. After this, an abrupt jump in the interconnect resistance is observed. At this stage an open circuit failure due to electromigration is already noticeable, and the electric current does not flow in the interconnect.
The electromigration TTFs for different applied current densities are determined by the times required to reach the maximum tolerable resistance level. Lifetimes are extracted from the resistance/time curves. The TTFs obtained with the two methods are of about the same order of magnitude, even if the mechanisms involved in the methodologies are different. The TTF versus current density curves are subsequently fitted to Black's equation, as shown in (5.10).
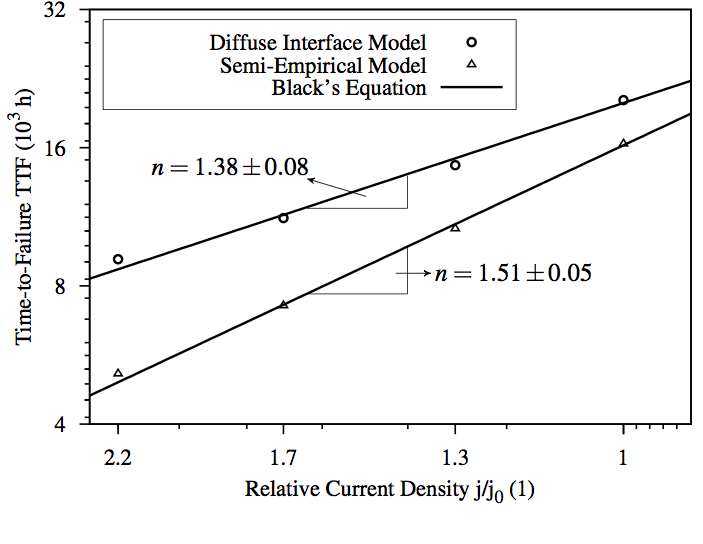 |
The result yields a current density exponent n of 1.38 for the analysis of the void growth which employees the diffuse interface method, while a value close to 1.5 is estimated using the semi-empirical model. It has been shown in Section 1.4.3 that a value close to 1 indicates that void evolution is the most dominant mechanism of electromigration failure, while a value close to 2 corresponds to a nucleation time dominated failure. Both results yield values between 1 and 2 which confirm that both void nucleation and void evolution are important mechanisms in the electromigration failure. The development of the electromigration model based on the combination of void nucleation together with the void growth mechanism well describes the electromigration failure analysis in open copper TSV technologies. Furthermore, the estimation of electromigration TTF in such structures follows Black's behavior, as shown in (5.10). The difference between the two curves presented in (5.10) is related to the methodology adopted for simulating the void evolution mechanism in the TSV structure. It should be noted that since the semi-empirical method involves approximations in the physical theory in order to simplify the numerical calculation, results obtained by using this approach are less accurate than results obtained by following the diffuse interface model. However, the semi-empirical model is useful because it speeds the simulation analysis.