Next: 4. The Charge-Pumping Technique Up: 3.4 Impact of the Carrier Distribution Function on HCD Modeling Previous: 3.4.1 Comparison of Different Transport Module Realizations
 |
For additional visualization of the obtained results in this Section, the worst-case conditions will be analyzed using simplified transport schemes. That is, the computational procedure presented in Section 3.3, which is based on the evaluation of the carrier distribution function along the Si/SiO2 interface is repeated for HD- and DD-based transport approaches. For these investigations only a long-channel 5V n-MOSFET (Figure 3.2) is employed. Moreover, the simplified treatment of carrier transport using a non-Maxwellian, analytical distribution function is also discussed.
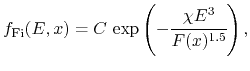
The most popular approach for analytical modeling of non-Maxwellian distribution functions is the Fiegna model [171,96]. This model is applicable for devices with a channel length longer than 0.5um which is suitable for our case. Within this approach the following expression for the DF is proposed
where C denotes the normalization constant and χ is a fitting parameter. This parameter may be adjusted in order to represent the real distribution function at a certain point. The choice of this point may substantially affect all results. The value of χ is found in a way which guarantees a minimal discrepancy between experimental and simulated charts Isub(Vds,Vgs).
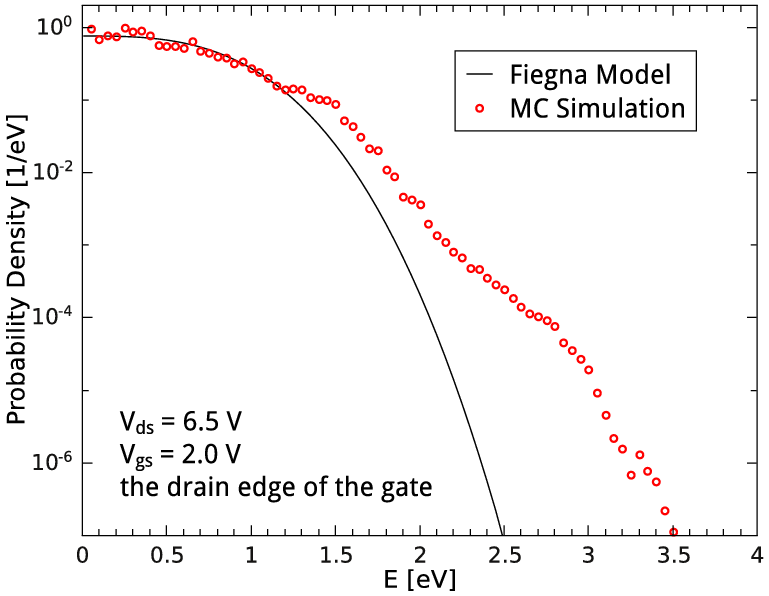
Explicitly, the value of χ used in this work is 1.62×10⁸eV-3V1.5cm-1.5 (note that values reported in papers [171] and [96] are 1.3×10⁸ and 0.8×10⁸eV-3V1.5cm-1.5, respectively). This parameter is found while fitting the distribution function at the drain end of the gate by the Fiegna expression, see Figure 3.16. The most significant discrepancy between these distribution functions is observed at higher energies. This circumstance suggests that the acceleration integrals calculated using these two different DFs should strongly diverge under conditions corresponding to the most extended high-energy tails of the distribution function.
The measured substrate current as a function of stress drain and gate voltages is depicted in Figure 3.10a. Figure 3.10c demonstrates the maximum value of the acceleration integral ISP plotted vs. Vds and Vgs and calculated within the HCD model which is based on the direct solution of the Boltzmann transport equation using the MC approach. Figure 3.17 demonstrates the same result as Figure 3.10c but the AI was calculated employing the fitting function fFi(E) and using HD/DD-based transport models. A comparison of these figures suggests several conclusions. In contrast to the Monte Carlo-based HCD model, which provides a very good agreement between the experiment and theory, the simplified versions which employs the Fiegna function instead of the real DF (as well as HD- and DD-based approaches) fail in the area of low Vgs with high Vds. In practice this regime is characterized by a low Idlin and thus degradation is weak (this trend is pronounced in Figure 3.10c). That is, ifVds is fixed and Vgs varies, the substrate current first grows, reaches its maximum and then decreases. This tendency is also supported by Figure 3.11a. However, according to the predictions from Figure 3.17 the maximum degradation dose monotonously increases with Vgs, i.e. WCC are obtained at Vds = 0V. In other words, one may finally conclude that simplified transport schemes cannot be used for proper HCD modeling.
(a)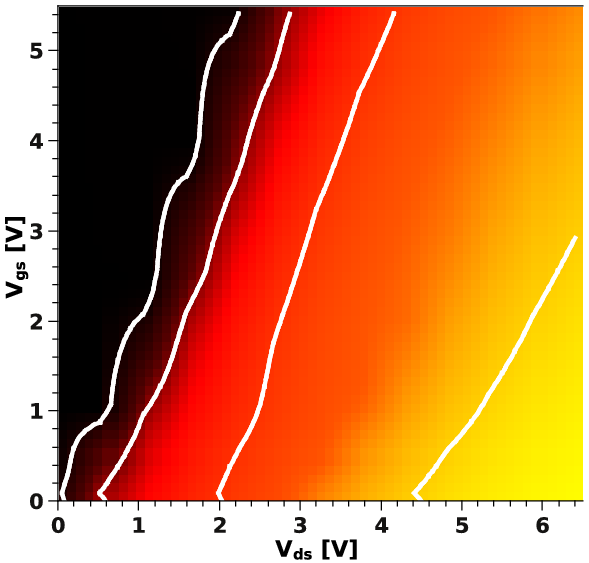 (b)
(b)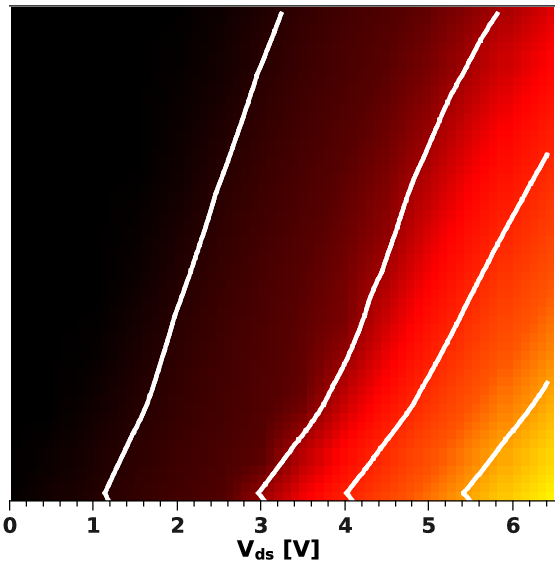 (c)
(c)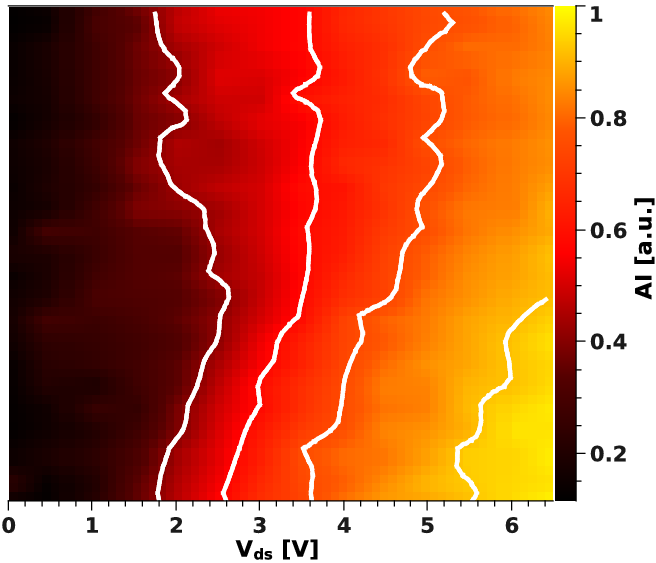
|