|
|
|
|
||
| Previous: 6.1.1 Strain-Induced Shift of the Conduction Band Minimum Up: 6.1 Bandstructure Calculations Next: 6.1.3 Subband Structure | ||||
|
|
[a] ![\includegraphics[width=7.8cm]{xcrv-scipts/XSplittingEpsxy_bw.eps}](img1060.png) [b]
[b]![\includegraphics[width=7.8cm]{xcrv-scipts/XSplitDup_bw1.eps}](img1061.png)
|
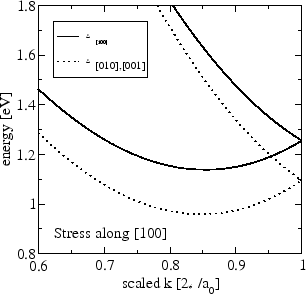
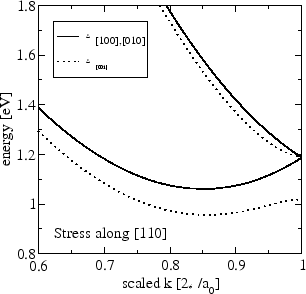
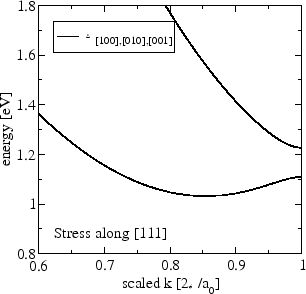
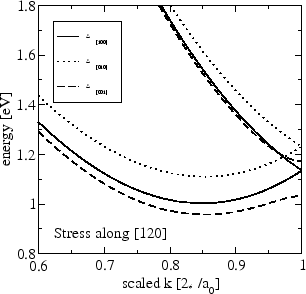
In Figure 6.6 the lifting of the degeneracy of the two lowest
conduction bands is analyzed as a function of
![]() . The splitting is linear
with
. The splitting is linear
with
![]() and can be approximated using the analytic expression
and can be approximated using the analytic expression
![]() using 7.0 eV for the shear deformation potential.
using 7.0 eV for the shear deformation potential.
The change of position of the minima of the conduction band edge and the
![]() -valley shifts resulting from shear strain
-valley shifts resulting from shear strain
![]() are plotted in
Figure 6.7, where results from EPM calculations are compared to the
analytical expressions (3.92) and (3.100).
are plotted in
Figure 6.7, where results from EPM calculations are compared to the
analytical expressions (3.92) and (3.100).
|
[a] ![\includegraphics[width=7.8cm]{xcrv-scipts/kMin_bw.eps}](img1063.png) [b]
[b]![\includegraphics[width=7.8cm]{xcrv-scipts/Delta4_2_epsxy_bw.eps}](img1064.png)
|
The shear strain-induced effective mass change of the transverse and
longitudinal mass characterizing the
![]() -valley pair of Si is
plotted in Figure 6.8. Again, results from the EPM are compared to the
analytical expressions, (3.94), (3.98), and
(3.99). Good agreement can be observed for
-valley pair of Si is
plotted in Figure 6.8. Again, results from the EPM are compared to the
analytical expressions, (3.94), (3.98), and
(3.99). Good agreement can be observed for
![]() . For
larger values of shear strain, the change of the effective masses as obtained
from kp theory is smaller than that from the empirical pseudopotential method.
. For
larger values of shear strain, the change of the effective masses as obtained
from kp theory is smaller than that from the empirical pseudopotential method.
|
[a] ![\includegraphics[width=7.8cm]{xcrv-scipts/mlCompEPM_KP_bw.eps}](img1066.png) [b]
[b]![\includegraphics[width=7.8cm]{xcrv-scipts/mtCompEPM_KP_bw.eps}](img1067.png)
|
The calculated change of the effective mass induced by shear strain has been compared to values extracted from cyclotron resonance measurements. Good agreement is achieved as can be seen in Figure 6.9.
![\includegraphics[width=11cm]{xcrv-scipts/henselMassComp.eps}](img1069.png)
|
Finally, in Figure 6.10 the constant-energy lines in the plane
![]() are shown. For increasing
are shown. For increasing
![]() the evolving
ellipsoid is characterized by two different transverse masses given in
(3.98) and (3.99). The principal axes of the
ellipses are [110] and
the evolving
ellipsoid is characterized by two different transverse masses given in
(3.98) and (3.99). The principal axes of the
ellipses are [110] and
![]() .
.
|
[
![\includegraphics[scale=1.2]{gnuplot/condBandMin001_exy0.0.eps}](img1071.png) [
[
![\includegraphics[scale=1.2]{gnuplot/condBandMin001_exy0.005.eps}](img1072.png)
[
![\includegraphics[scale=1.2]{gnuplot/condBandMin001_exy0.01.eps}](img1073.png) [
[
![\includegraphics[scale=1.2]{gnuplot/condBandMin001_exy0.015.eps}](img1074.png)
|
|
|
|
|
||
| Previous: 6.1.1 Strain-Induced Shift of the Conduction Band Minimum Up: 6.1 Bandstructure Calculations Next: 6.1.3 Subband Structure | ||||