« PreviousUpNext »Contents
Previous: 5 Results and Discussion Top: 5 Results and Discussion Next: 5.3 The Three Phases of the Electromigration Induced Vacancy Accumulation
5.2 Interface Vacancy Pile-Up
This study deals with the question of how different interface structures change the vacancy concentrations at the interface. Interfaces can limit the flux of vacancies, according to the segregation model (c.f. Section 3.3.3), as well as they can act as high diffusive paths for the vacancies along them [34]. For the tungsten/aluminium interface the interface behavior was studied for different parameters to get an idea, which results have to be expected for the structure shown in Figure 5.5.
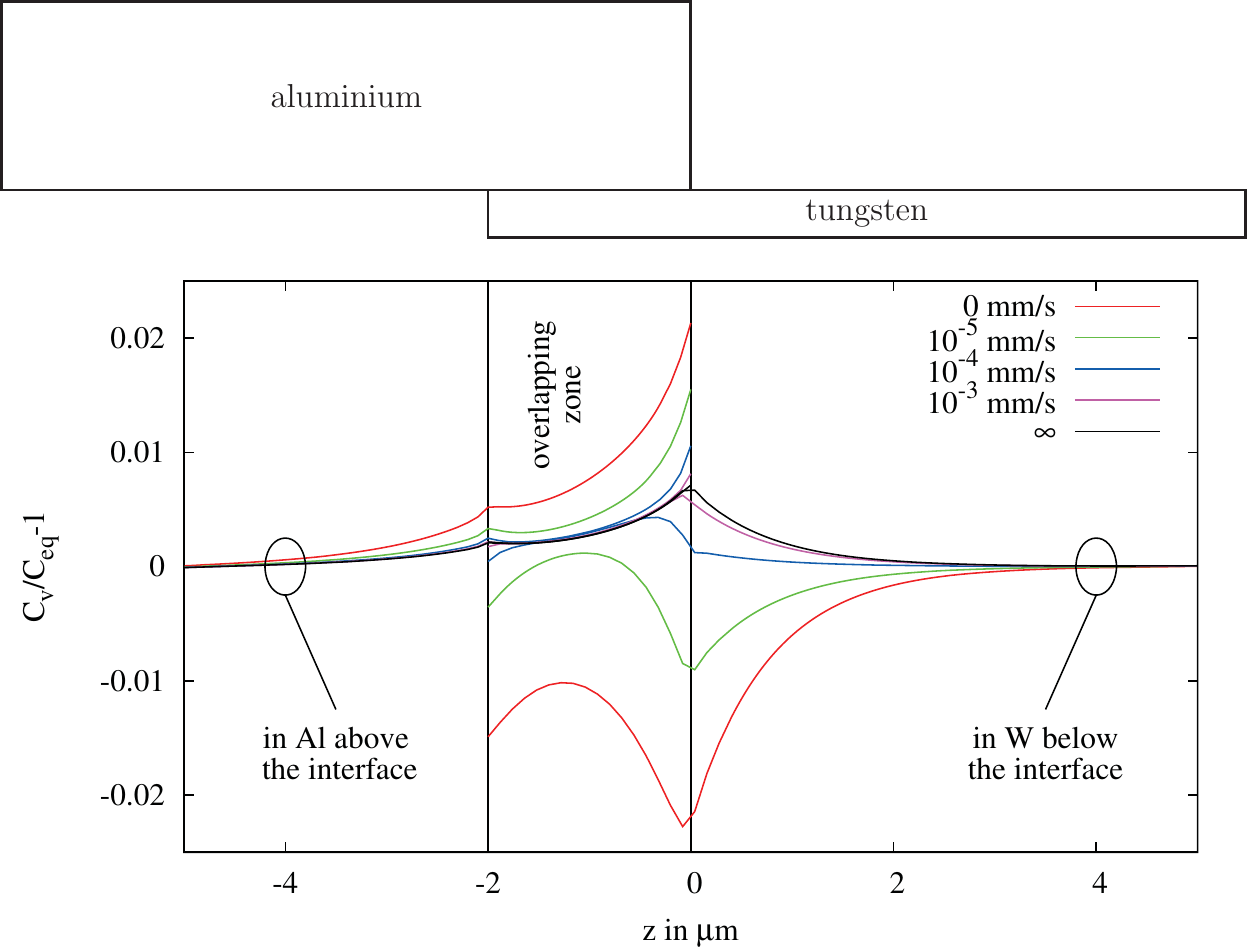
Figure 5.10.: Segregation model: Variation of the transport coefficient  . Vacancy concentration in aluminium and in tungsten versus the location of the inter-
face.
. Vacancy concentration in aluminium and in tungsten versus the location of the inter-
face.
Figure 5.10 shows the vacancy concentration close to the interface in the aluminium represented by the upper curves and the tungsten by the lower curves for different interface conductivities normalized by the equilibrium concentration. Due to the partial blocking of the interface, vacancies are piled up in the aluminium layer close to the interface, whereas in the tungsten layer the vacancies close to the interface flow away and cannot be recovered. Therefore, the concentration in this region is lower compared to the
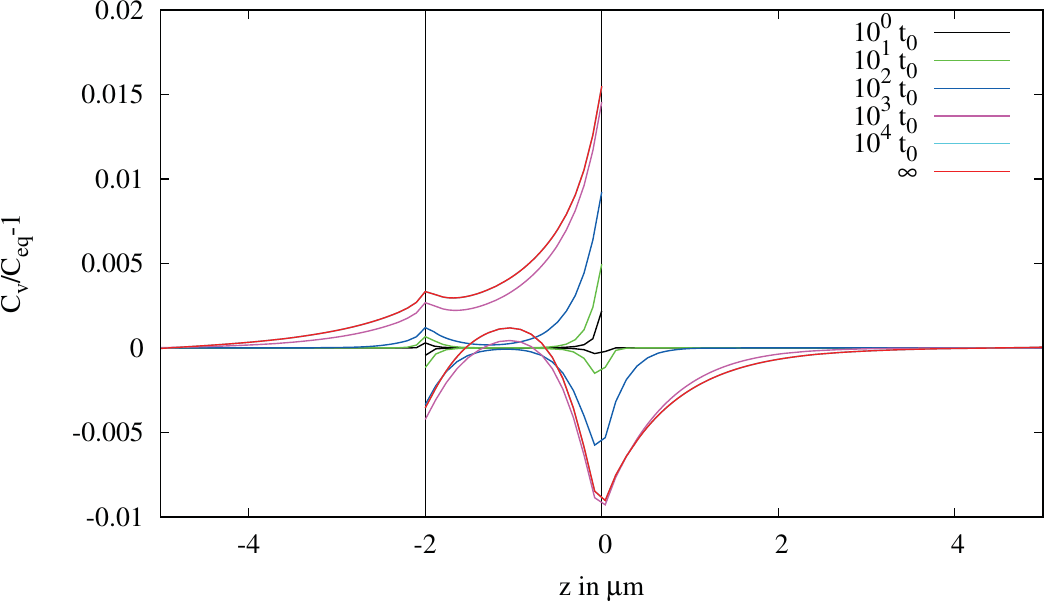
Figure 5.11.: Simulation of a highly blocking interface  for dif-
ferent time steps in arbitrary
for dif-
ferent time steps in arbitrary  units.
equilibrium concentration. The highest deviations from the equilibrium concentrations are found at the edges of the interface. There, as shown in Section 5.1, the highest perpendicular component of the current density is found. This component of the current density is responsible for the delivery of vacancies to the interface in the aluminium and for the transport of vacancies away from the interface in the tungsten region. This phenomenon gets stronger the more the interface exhibits a blocking behavior. As explained in the segregation model (cf. Section 3.3.3) the interface can be understood as the infinitely thin limit of a region with a diffusion coefficient low against the other materials. Seen form this point, the interface has a high divergence due to the deviation of the diffusion coefficient which explains the observed results. Farther away from the interface the concentration converges back to the equilibrium.
Figure 5.11 shows the development of the vacancy pile-up in time for a chosen highly blocking value. At the corners the deviation increases fast compared to the middle region. After some time the concentration in the tungsten starts to increase in the middle region in contrast to the edge areas. This is caused by the vacancies that at first diffuse form the edge area in the aluminium to the middle part of the aluminium interface region and then are transported back through the interface into the tungsten, as they experience there a lower EM induced driving force. It should be remarked that also for an interface without segregation a deviation from the equilibrium concentration can be observed, due to current crowding at the edges. However, this effect is of equal strength in both layers.
A second phenomenon which can occur at interfaces between materials is a higher vacancy equilibrium concentration in the Rosenberg-Ohring term ( . Section 5.7).
Figure 5.12 depicts the results of simulations, where the equilibrium concentration of the interface is varied. The black line represents the result for a simulation where the interface behaves exactly like the metal layers. The increase of
the concentration is driven by the in-homogeneous current, which again has the highest impact at the interface edges due to current crowding. For lower interface equilibrium concentrations the results decrease as the interface
annihilates vacancies. Here, current crowding at
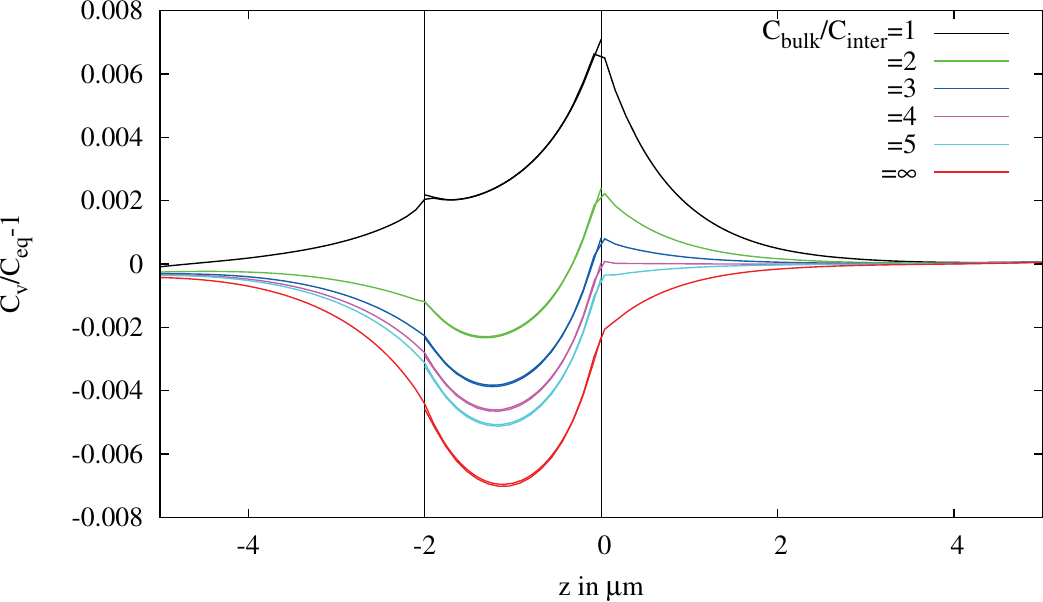
Figure 5.12.: Variation of the equilibrium concentration in the interface region.
Figure 5.13.: Rosenberg-Ohring model: Results at different time steps for the lowest possible equilibrium concentration  .
.
the edges floods the interface region with vacancies and, therefore, to some degree the impact of the vacancy annihilation is compensated. Figure 5.13 shows the evolution in time for the lowest possible equilibrium concentration of
the interface of  For short periods the EM induced vacancy transport at the left corner overwhelms the process of annihilation, as can be seen by the slightly positive vacancy concentration. Whereas after longer time
periods the behavior flips into an annihilation dominated one.
For short periods the EM induced vacancy transport at the left corner overwhelms the process of annihilation, as can be seen by the slightly positive vacancy concentration. Whereas after longer time
periods the behavior flips into an annihilation dominated one.
The results show that the worst case behavior is the total blocking interface, as there the pile-up of vacancies in the aluminium layer and the depletion in the tungsten layer lead to the highest deviation from the equilibrium concentration. Furthermore, for the annihilation behavior there are two extremes observable. For equilibrium concentrations the vacancy concentrations at the corners increase relative to the outer regions, whereas for highly annihilating interfaces the concentrations of the vacancies decrease compared to the outer regions. Therefore, for the aluminium layer in addition to the segregation behavior, the non-annihilating interface is the worst case. In contrast, for the tungsten layer the highly annihilating interface is the worst case. As the diffusion constant of the tungsten is much lower compared to the aluminium, for the following simulation the blocking interface with non-annihilation character is admissible.
« PreviousUpNext »ContentsPrevious: 5 Results and Discussion Top: 5 Results and Discussion Next: 5.3 The Three Phases of the Electromigration Induced Vacancy Accumulation