|
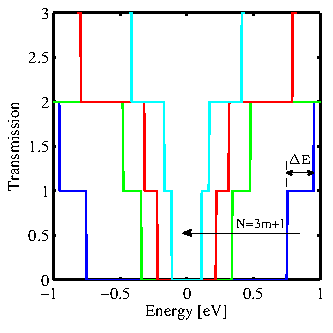
The ballistic transmission function of AGNRs with different widths is shown
in Fig. 3.2. As expected, the energy-gap between
conduction and valence band decreases with increasing the ribbon's
width. Here, we also denote the energy difference between the second and
the first conduction subband by ![]() . This parameter indicates the possibility of a contribution of the second subband to the electronic transport.
. This parameter indicates the possibility of a contribution of the second subband to the electronic transport. ![]() and
and ![]() decrease by increasing the ribbons' width. On the other hand, the derivative of the Fermi function, known as the thermal broadening function, has a width of a few
decrease by increasing the ribbons' width. On the other hand, the derivative of the Fermi function, known as the thermal broadening function, has a width of a few
![]() around
around
![]() . Therefore, the width of the thermal broadening function increases
with the temperature and, at high temperature, one can expect the second subband also contribute to the electronic conductance of a wide AGNRs.
. Therefore, the width of the thermal broadening function increases
with the temperature and, at high temperature, one can expect the second subband also contribute to the electronic conductance of a wide AGNRs.
|
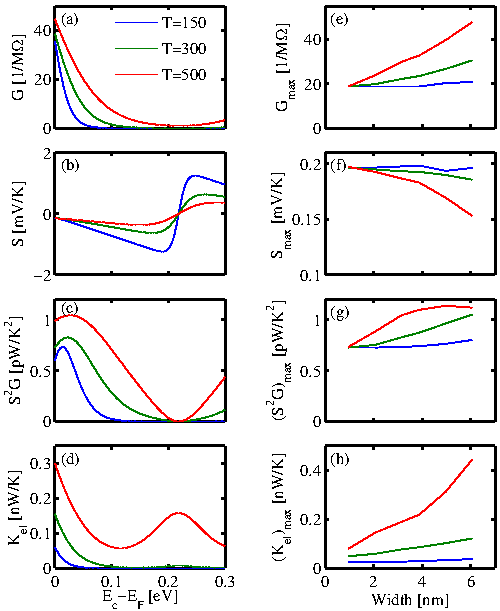
The electrical conductance (Eq. 2.29), the Seebeck coefficient (Eq. 2.37), the
thermoelectric power factor (![]() ), and the electrical contribution to the
thermal conductance (Eq. 2.36) of a 25-AGNR as a function of Fermi energy
are shown in Fig. 3.3a-d, respectively. Three different
temperatures
), and the electrical contribution to the
thermal conductance (Eq. 2.36) of a 25-AGNR as a function of Fermi energy
are shown in Fig. 3.3a-d, respectively. Three different
temperatures
![]() ,
,
![]() , and
, and
![]() are considered. Here,
are considered. Here, ![]() refers to the energy
corresponding to the band-edge of the first conduction subband. In
contrast to the Seebeck coefficient, the electrical conductance
decreases by increasing
refers to the energy
corresponding to the band-edge of the first conduction subband. In
contrast to the Seebeck coefficient, the electrical conductance
decreases by increasing
![]() , so that the power factor
has a maximum near the conduction band-edge. The maximum value of the power factor increases with
temperature due to the contribution of the second conduction subband. Different parameters, corresponding to the Fermi
energy at which the power factor is maximum, are shown in Fig. 3.3e-f. By increasing the ribbon's width and so decreasing
, so that the power factor
has a maximum near the conduction band-edge. The maximum value of the power factor increases with
temperature due to the contribution of the second conduction subband. Different parameters, corresponding to the Fermi
energy at which the power factor is maximum, are shown in Fig. 3.3e-f. By increasing the ribbon's width and so decreasing ![]() , the second conduction
band-edge gets closer to the first conduction band-edge
, the second conduction
band-edge gets closer to the first conduction band-edge ![]() . As a
result, the overall tranmission function increases near the appropriate Fermi
energy, and so the conductance increases with the ribbon's width. This increase is significant at high temperature. On the other hand, the band-gap
and so the Seebeck coefficient decrease by increasing
. As a
result, the overall tranmission function increases near the appropriate Fermi
energy, and so the conductance increases with the ribbon's width. This increase is significant at high temperature. On the other hand, the band-gap
and so the Seebeck coefficient decrease by increasing ![]() . It is due to the fact that in a low band-gap material, the current of holes and electrons cancel each other out. Overall, the power factor slightly increases by the ribbon's width and
temperature. In addition, the electrical contribution to the thermal
conductance increases with the ribbon's width and temperature, as
well. However, as shown below, it can be neglected in comparison with the lattice thermal conductance.
. It is due to the fact that in a low band-gap material, the current of holes and electrons cancel each other out. Overall, the power factor slightly increases by the ribbon's width and
temperature. In addition, the electrical contribution to the thermal
conductance increases with the ribbon's width and temperature, as
well. However, as shown below, it can be neglected in comparison with the lattice thermal conductance.