|
|
|
|
Dissertation Martin Wagner | Previous: 4. Materials for Thermoelectric Devices Up: 4. Materials for Thermoelectric Devices Next: 4.2 Optimization of Device Performance |
|
|
|
|
Dissertation Martin Wagner | Previous: 4. Materials for Thermoelectric Devices Up: 4. Materials for Thermoelectric Devices Next: 4.2 Optimization of Device Performance |
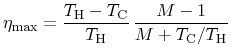
The overall performance of a thermoelectric generator is rated by characteristic numbers as its efficiency, total power output, and power density. However, these numbers, especially the efficiency, is limited by several parameters. Besides the geometrical impact, material parameters such as the Seebeck coefficient as well as thermal and electrical conductivities have a strong influence on both transport of carriers and phonons and thus the overall device behavior. In the sequel, the thermoelectric figure of merit, which embraces the material parameters affecting the device behavior, as well as its influence on the device efficiency are discussed.
According to Ioffe [7], the maximum conversion efficiency
![]() of a thermoelectric generator at matched load condition
of a thermoelectric generator at matched load condition
![]() is given by the product of the ideal reversible
thermodynamic process' efficiency and a factor describing the energy losses
within the device due to Joule heating and non-ideal thermal conductivity
[11]
is given by the product of the ideal reversible
thermodynamic process' efficiency and a factor describing the energy losses
within the device due to Joule heating and non-ideal thermal conductivity
[11]
 |
(4.3) |
An ideal thermoelectric material is not only assured by a high figure of merit, but also by the temperature range, where these high values are achieved. In practical situations, each material has its ideal operation temperature range, thus the choice of the material is strongly affected by the intended use.
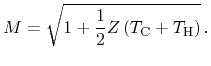
![\includegraphics[width=10cm]{figures/materials/Z.eps}](img565.png) |
The free carrier concentration which is influenced by the doping in
semiconductors, has a strong influence on the figure of merit.
Fig. 4.1 illustrates the dependence of several material parameters on
the concentration of free carriers. While increasing carrier concentrations
have generally a detrimental effect on the Seebeck coefficient, the electric
conductivity ![]() increases due to the increased number of available
carriers. On the other hand, the electric part of the thermal conductivity
increases due to the increased number of available
carriers. On the other hand, the electric part of the thermal conductivity
![]() becomes non-negligible at high values of the carrier concentration
and the dominant thermal conductivity mechanism on the transition to metals.
Both insulators and metals show superior conditions for single parameters, but
accordingly poor conditions for others. Metals are characterized by generally
low values of the Seebeck coefficient and comparably high thermal
conductivities, which cannot be compensated by their low electric resistances.
On the other hand, insulators have comparably high Seebeck coefficients,
which cannot outperform the very low electric conductivities. Semiconductors
are positioned in the competition region of the single parameters, and thus the
resulting thermoelectric figure of merit has its maximum. This maximum is
supported by still moderate Seebeck coefficients and already good electrical
conductivities and limited by elevated electrical thermal conductivity in the
region of high carrier concentrations. Within semiconductors, the optimum
carrier concentration can be accurately controlled by proper doping
concentrations.
becomes non-negligible at high values of the carrier concentration
and the dominant thermal conductivity mechanism on the transition to metals.
Both insulators and metals show superior conditions for single parameters, but
accordingly poor conditions for others. Metals are characterized by generally
low values of the Seebeck coefficient and comparably high thermal
conductivities, which cannot be compensated by their low electric resistances.
On the other hand, insulators have comparably high Seebeck coefficients,
which cannot outperform the very low electric conductivities. Semiconductors
are positioned in the competition region of the single parameters, and thus the
resulting thermoelectric figure of merit has its maximum. This maximum is
supported by still moderate Seebeck coefficients and already good electrical
conductivities and limited by elevated electrical thermal conductivity in the
region of high carrier concentrations. Within semiconductors, the optimum
carrier concentration can be accurately controlled by proper doping
concentrations.
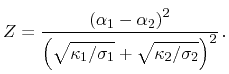
![\includegraphics[width=10cm]{figures/materials/Z_temp.eps}](img566.png) |
Temperature dependent figure of merit data for materials commonly used in thermoelectric devices are collected in Fig. 4.2. While bismuth telluride and several ternary alloys area good choice for low temperature thermoelectrics, silicon and silicon-germanium alloys are suitable for higher temperatures. Lead telluride covers the intermediate range between bismuth telluride and silicon-germanium. For even higher temperatures, wide band gap materials such as silicon carbide and boron carbide have to be considered. The dashed line depicts the product of the figure of merit and temperature to be one. Maximum figure of merit values for several materials do not outperform this line by far which results in an accordingly limited conversion efficiency.
M. Wagner: Simulation of Thermoelectric Devices