|
|
|
|
Dissertation Martin Wagner | Previous: 5.3.2 Effective Masses, Density of States, Intrinsic Carrier Up: 5. Physical Modeling of PbTe and PbSnTe Next: 5.5 Generation and Recombination |
|
|
|
|
Dissertation Martin Wagner | Previous: 5.3.2 Effective Masses, Density of States, Intrinsic Carrier Up: 5. Physical Modeling of PbTe and PbSnTe Next: 5.5 Generation and Recombination |
Lead telluride attracts attention due to its extraordinarily high carrier
mobilities at low temperatures. Values of
![]() and
and
![]() have been reported for electrons and holes,
respectively at
have been reported for electrons and holes,
respectively at
![]() , which reduce to
, which reduce to
![]() and
and
![]() at room temperature [270]. The mobilities for
electrons and holes,
at room temperature [270]. The mobilities for
electrons and holes,
![]() and
and
![]() are limited by carrier scattering
within the semiconductor. The electron mobility model is based on experimental
and Monte-Carlo simulation data [271], while the hole mobility
model relies on collected measurement data.
are limited by carrier scattering
within the semiconductor. The electron mobility model is based on experimental
and Monte-Carlo simulation data [271], while the hole mobility
model relies on collected measurement data.
The Monte-Carlo technique serves as a powerful link between measurement data and models for device simulation in hierarchical device simulation [79]. Macroscopic average quantities such as carrier mobility and energy relaxation times are derived from the microscopic behavior of single electrons with statistical methods. Bulk Monte-Carlo simulations have been carried out using the Vienna Monte Carlo simulator (VMC) [204] applying a single particle Monte Carlo technique. For the analysis, the two lowest conduction band valleys at L and W points, respectively are incorporated. Several relevant stochastic mechanisms are considered, which are phonon scattering in the acoustic and optical branch, polar optical phonon scattering, optical deformation potential scattering, L-L intravalley scattering, and scattering by ionized impurities. The band structure is described by a non-parabolic approximation of the valleys using Kane's formula [77]
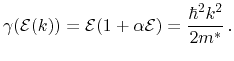 |
(5.41) |
Only a few Monte-Carlo simulations are currently documented in literature for
lead telluride. The negative differential mobility at "high-field"
conditions in lead telluride has been investigated in [272] at
![]() . This work has been extended to selected lead-tin telluride
alloys in [273]. A comprehensive investigation including both
measurements and Monte-Carlo simulation results for the hot-electron behavior
in lead telluride as well as lead-tin telluride alloys is presented in
[274]. However, all these studies are limited to a temperature of
. This work has been extended to selected lead-tin telluride
alloys in [273]. A comprehensive investigation including both
measurements and Monte-Carlo simulation results for the hot-electron behavior
in lead telluride as well as lead-tin telluride alloys is presented in
[274]. However, all these studies are limited to a temperature of
![]() and focus on the influence of the W-valley.
In recent work, Palankovski et al. [275] provided
results for the electron mobility as a function of temperature up to
and focus on the influence of the W-valley.
In recent work, Palankovski et al. [275] provided
results for the electron mobility as a function of temperature up to
![]() , carrier concentration, and electric field.
, carrier concentration, and electric field.
In contrast to semiconductors with wider band gaps such as silicon, the
temperature dependence of several parameters becomes more pronounced. Thus,
these parameters are modeled accordingly by introducing temperature dependent
expressions. Model parameters applied in the simulations are collected in
Table 5.9.
![\includegraphics[width=10cm]{figures/materials/PbTe/mobility/PbTeTemp_ravich_1900.eps}](img802.png) |
Doping dependent mobility degradation due to ionized impurity scattering is introduced using a simplified Caughey-Thomas equation [276]
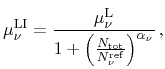 |
(5.43) |
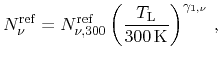 |
(5.44) |
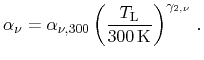 |
(5.45) |
M. Wagner: Simulation of Thermoelectric Devices
![\includegraphics[width=10cm]{figures/materials/PbTe/mobility/PbTe300dop.eps}](img803.png)
![\includegraphics[width=10cm]{figures/materials/PbTe/mobility/hole_mob.eps}](img804.png)