7.5.1 Entire Relaxation
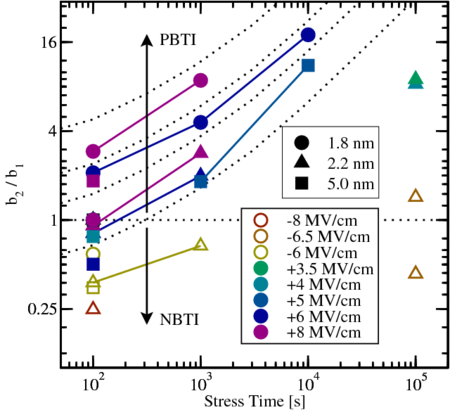
Interestingly, when the ratio  of each relaxation curve is plotted over the
stress time, the resulting curves are ranked according to their electric field during
the stress. In Fig. 7.9 equal
of each relaxation curve is plotted over the
stress time, the resulting curves are ranked according to their electric field during
the stress. In Fig. 7.9 equal  conditions at various
  values are connected
for better visibility and are separated by dotted lines for different electric fields.
Different
values are connected
for better visibility and are separated by dotted lines for different electric fields.
Different  values ranging from NBTI with
  up to PBTI with
 result in gradually increasing
  , despite some minor
deviations for different device thicknesses. Samples stressed with NBTI feature a
, despite some minor
deviations for different device thicknesses. Samples stressed with NBTI feature a
 smaller or equal to
  due to only a small kink or no kink at
all, while on the other hand PBTI stress, shows ratios from
due to only a small kink or no kink at
all, while on the other hand PBTI stress, shows ratios from  up to
up to
 .
.
Hence, the ratio  gives a measure of the symmetricity of the relaxation
curve. The ratio indicates which section of the relaxation transient the original
experiment recorded. If
gives a measure of the symmetricity of the relaxation
curve. The ratio indicates which section of the relaxation transient the original
experiment recorded. If  , the experiment probed the second half of the
S-shape, i.e. the long-term relaxation, which is usually the case after NBTI. For
, the experiment probed the second half of the
S-shape, i.e. the long-term relaxation, which is usually the case after NBTI. For
 , the “main” part of the relaxation was monitored and both the initial
as well as the late relaxation phase contribute to the total recovery to about the
same degree.
, the “main” part of the relaxation was monitored and both the initial
as well as the late relaxation phase contribute to the total recovery to about the
same degree.
Modeling the recovery with a single slope, which would then be approximately
equal to the geometric mean of  and
and  , clearly obscures the fact that the
oxide electric field has an impact not only on the slope, but on the shape of the
recovery as well. As depicted in Fig. 7.10, with a mean recovery it is thus only
possible to distinguish between the
, clearly obscures the fact that the
oxide electric field has an impact not only on the slope, but on the shape of the
recovery as well. As depicted in Fig. 7.10, with a mean recovery it is thus only
possible to distinguish between the  . Moreover, the geometric mean requires
symmetricity of the recovery trace, which is only given under moderate stress
conditions.
. Moreover, the geometric mean requires
symmetricity of the recovery trace, which is only given under moderate stress
conditions.
 increases with increasing
  and
and  ranging from NBTI with
  up to PBTI with
  .
NBTI-stressed samples with a negative kink feature a ratio smaller or equal
to
.
NBTI-stressed samples with a negative kink feature a ratio smaller or equal
to  , whereas PBTI-stressed ones possess values from
  up to
up to  . Higher
ratios are restricted by the maximum allowed electric field
. Higher
ratios are restricted by the maximum allowed electric field  before the
oxide breaks down.
before the
oxide breaks down. 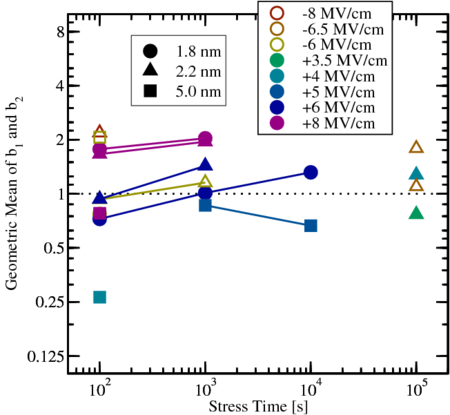
 . Hence, the geometric mean
of
. Hence, the geometric mean
of  and
and  is nearly constant for all analyzed devices despite its weak
 -dependence. This implies that the evaluation of a single slope is not
valid for heavier stress conditions because of the asymmetric and limited
observation period.
-dependence. This implies that the evaluation of a single slope is not
valid for heavier stress conditions because of the asymmetric and limited
observation period.