8.5.1 Approximation of the Vibronic Transition
Basically, the calculation of the LSF via DFT is feasible, but since the motion of
a polyatomic structure, especially at  , is highly complex to treat,
simplifications need to be made. By limiting the movement of the defect system
to only one vibrational mode (single-mode coupling), the defect transition
can be modeled along its most dominant reaction path or coordinate
[153, 151]. The total energy
, is highly complex to treat,
simplifications need to be made. By limiting the movement of the defect system
to only one vibrational mode (single-mode coupling), the defect transition
can be modeled along its most dominant reaction path or coordinate
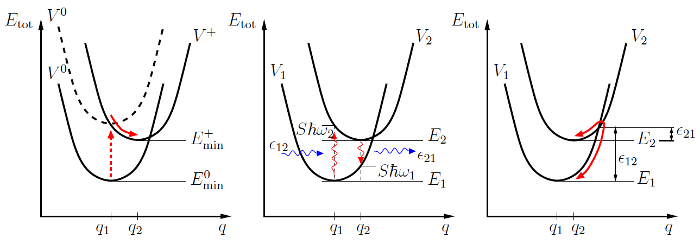
[153, 151]. The total energy  as a function of corresponding reaction
coordinates (RC) can be further approximated by parabolic potential
energy curves (PEC) [158], like schematically depicted in Fig. 8.6. Though
originally used for small distortions around the equilibrium, such an harmonic
approach is also able to model strong distortions of the defect system
[159, 126].
as a function of corresponding reaction
coordinates (RC) can be further approximated by parabolic potential
energy curves (PEC) [158], like schematically depicted in Fig. 8.6. Though
originally used for small distortions around the equilibrium, such an harmonic
approach is also able to model strong distortions of the defect system
[159, 126].
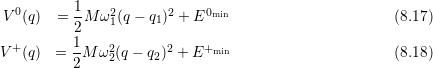
The two solid parabolic potentials in the left of Fig. 8.6 are now given by
with the mass  and the vibrational frequencies
  ,
,  of the defect system.
The minimum of
of the defect system.
The minimum of  corresponds to the initial defect configuration. When for
example examining hole capture, the defect system has to change from
corresponds to the initial defect configuration. When for
example examining hole capture, the defect system has to change from  into its charged configuration
  . This can be achieved by applying a bias
which shifts the uncharged defect configuration (solid
. This can be achieved by applying a bias
which shifts the uncharged defect configuration (solid  ) with respect to the
charged configuration upwards (dashed
) with respect to the
charged configuration upwards (dashed  ). When assuming
  , i.e. there
are no phonons, the tunneling process can only occur when the shifted ground
state crosses the positive configuration. Starting from
, i.e. there
are no phonons, the tunneling process can only occur when the shifted ground
state crosses the positive configuration. Starting from  , structural
relaxation to the minimum
, structural
relaxation to the minimum  takes place. This is accomplished
by the emission of phonons. Fowler et al. used this picture to model
electron tunneling between semiconductor bands and insulator traps at the
interface, i.e. band-to-trap tunneling, followed by structural relaxation
[160].
takes place. This is accomplished
by the emission of phonons. Fowler et al. used this picture to model
electron tunneling between semiconductor bands and insulator traps at the
interface, i.e. band-to-trap tunneling, followed by structural relaxation
[160].
 as a function of the reaction
coordinate
as a function of the reaction
coordinate  reveals various transition possibilities of certain defects
systems
reveals various transition possibilities of certain defects
systems  or
or
 , respectively, the defect state can be changed (multi-phonon emission
(MPE)). Subsequent structural relaxation always restores the system to the
respective equilibrium in both cases. The emitted energy is called relaxation
energy
, respectively, the defect state can be changed (multi-phonon emission
(MPE)). Subsequent structural relaxation always restores the system to the
respective equilibrium in both cases. The emitted energy is called relaxation
energy  . In the case of linear coupling (
 ),
), 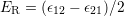 .
.
 and
and  required have to be supplied by phonons. Classically, the defect
has to overcome the barrier determined by the intersection point of the
parabolas with reference to
required have to be supplied by phonons. Classically, the defect
has to overcome the barrier determined by the intersection point of the
parabolas with reference to  and
and  .
.