 |
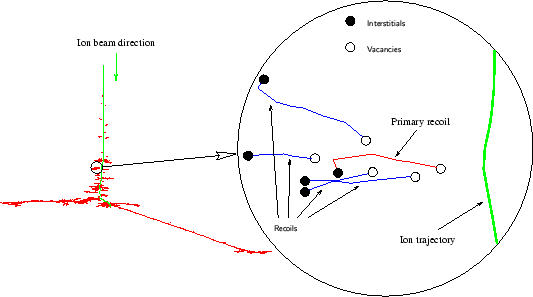
A very accurate method to calculate the generation of point defects is the Follow-Each-Recoil method. Thereby not only the trajectories of the implanted ions are rigorously calculated but also the trajectories of all recoiled particles. Starting at the position of the primary knock on a recoil behaves identical as an implanted particle just with different physical properties when calculating the nuclear and electronic energy loss.
As indicated in Fig. 3.12 a vacancy is generated whenever an atom is removed from its lattice site and whenever a particle (implanted or recoiled) comes to rest an interstitial atom is created.
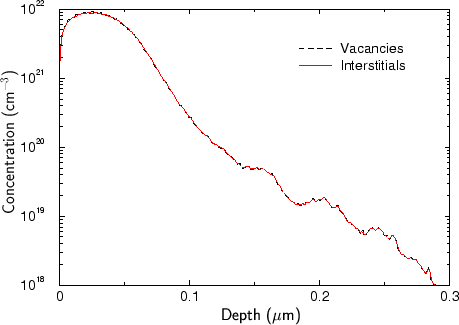
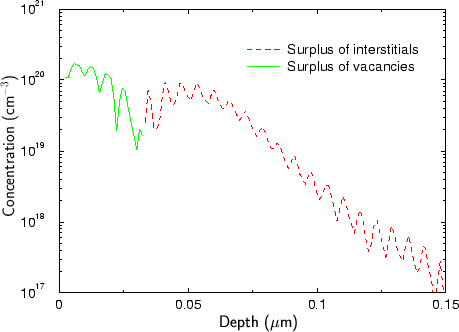
The major advantage of the Follow-Each-Recoil method compared to the Kinchin-Pease model is that not only the number of point defects can be accurately calculated but also their location. As shown in Fig. 3.13 and Fig. 3.14 there is typically a small offset between the vacancy and the interstitial distributions. Fig. 3.14 shows the difference of the interstitial and the vacancy concentration. To give an impression of the order of this difference compared to the total point defect concentration also the total concentration of the interstitials and the vacancies are plotted in Fig. 3.13. The reason why there is an offset between the vacancy and the interstitial concentration is that the later ones penetrate deeper into the target.
 |
 |
The exact knowledge of this offset is very important for the simulation of rapid thermal annealing (RTA) processes which are strongly influenced by transient enhanced diffusion (TED) effects.
Moreover the Follow-Each-Recoil method is not only capable of calculating point defect distributions but also the pollution by impurities removed from layers of different material. For instance oxygen atoms from screening oxide layers are knocked into the silicon substrate by ion implantation. Examples for this pollution effects will be presented in Sec. 5.3.
![]()
![]()
![]()
![]() Previous: 3.3.5.1 Modified Kinchin-Pease Model
Up: 3.3.5 Material Damage -
Next: 3.3.5.3 Point Defect Recombination
Previous: 3.3.5.1 Modified Kinchin-Pease Model
Up: 3.3.5 Material Damage -
Next: 3.3.5.3 Point Defect Recombination