3.3 Dielectric Response
We compare our TB results with first principles calculations introduced in
Sec. 3.1.1. The optical polarization vector is assumed to be along the transport
direction similar to the assumption made in the TB calculation.
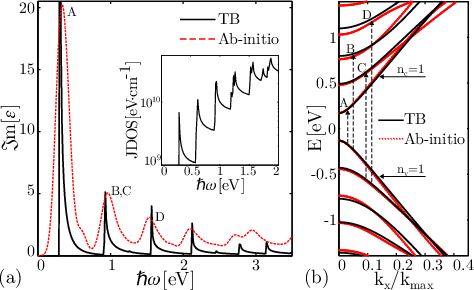
Figure 3.4(a) exhibits εi(ω) and the JDOS of AGNR20BN40.
In the energy range 0 < ℏω < 2 eV the JDOS has maxima at
ℏω = 0.3019, 0.62214, 0.92657, 0.91883, 1.2289,1.5256, and 1.7349 eV. However, only four of these maxima (ℏω = 0.3019, 0.91883,0.92657, and 1.5256 eV) appear in εi(ω). From the electronic band-structure in
Fig. 3.4(b) it can be shown that the peaks in εi(ω) are related to transitions
from nv = 1 to nc = 1 (A), nv = 1 to nc = 3 (B), nv = 2 to nc = 2 (C),
and nv = 2 to nc = 4 (D). Disappeared peaks in εi(ω) are due to zero
momentum matrix elements in Eq. 3.4. This transition rule confirms
previous results which are explained by the symmetry properties of the wave
functions.
Figure 3.4(a) compares the dielectric functions of an AGNR20BN40 obtained
from TB and first principle calculations. Excellent agreement between these
results confirms the transition rules obtained from TB calculations. The energy of
the first peak matches well, however, the discrepancies increase for higher
peaks. This behavior is related to the differences between the predicted
energy-gaps obtained from SIESTA and TB at higher energies, see Fig. 3.4(b).
In order to investigate AGNRs/BN for photodetection application, we study
the quantum efficiency defined as α =  ∕
∕ , where Iph is the
photo current and Pop is the incident optical power. We assumed that all
absorbed photons contribute to the photo current, such that the quantum
efficiency can be calculated from the dielectric function (Eq. 3.4). A quantum
efficiency of 6 - 16% for graphene is reported in Ref. [82] and a maximum
quantum efficiency ranging from 9% to 11% is reported for H-AGNRs
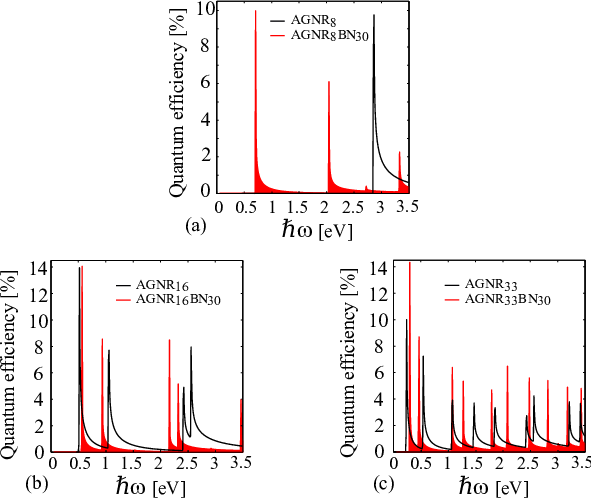
in Ref. [171]. Figure 3.5 shows the calculated quantum efficiency as
a function of the incident photon energy at various GNR widths. The
efficiency is maximized when the photon energy matches the bandgap of the
nanoribbon (the first peak for each structure). Our results indicate a
peak of quantum efficiency in the range of 14 - 15% for AGNRs/BN.
The quantum efficiencies of photodetectors based on AGNRs/BN and
H-AGNRs are compared in Fig. 3.5. Due to the presence of more allowed
transitions a wider absorption spectrum is achieved in AGNRs/BN compared
to H-AGNRs. As a H-AGNR with index 8 is metallic, the first peak is
related to the second energy-gap and appears at 2.88 eV whereas the
AGNR8BN30 shows three peaks below that energy due to energy-gap opening, see
Fig. 3.5(a). In Fig. 3.5, the quantum efficiency decreases for the first
energies, but increases at higher energies, see for example the sixth peak
for AGNR33BN30 (Fig. 3.5(c)). This is due to different effective masses
of different subbands which affect the JDOS. According to Eq. 3.4, a
larger JDOS leads to a larger absorption of photons and a higher quantum
efficiency.
, where Iph is the
photo current and Pop is the incident optical power. We assumed that all
absorbed photons contribute to the photo current, such that the quantum
efficiency can be calculated from the dielectric function (Eq. 3.4). A quantum
efficiency of 6 - 16% for graphene is reported in Ref. [82] and a maximum
quantum efficiency ranging from 9% to 11% is reported for H-AGNRs
in Ref. [171]. Figure 3.5 shows the calculated quantum efficiency as
a function of the incident photon energy at various GNR widths. The
efficiency is maximized when the photon energy matches the bandgap of the
nanoribbon (the first peak for each structure). Our results indicate a
peak of quantum efficiency in the range of 14 - 15% for AGNRs/BN.
The quantum efficiencies of photodetectors based on AGNRs/BN and
H-AGNRs are compared in Fig. 3.5. Due to the presence of more allowed
transitions a wider absorption spectrum is achieved in AGNRs/BN compared
to H-AGNRs. As a H-AGNR with index 8 is metallic, the first peak is
related to the second energy-gap and appears at 2.88 eV whereas the
AGNR8BN30 shows three peaks below that energy due to energy-gap opening, see
Fig. 3.5(a). In Fig. 3.5, the quantum efficiency decreases for the first
energies, but increases at higher energies, see for example the sixth peak
for AGNR33BN30 (Fig. 3.5(c)). This is due to different effective masses
of different subbands which affect the JDOS. According to Eq. 3.4, a
larger JDOS leads to a larger absorption of photons and a higher quantum
efficiency.
We also investigate the photoresponsivity given by  . Our
calculations give an upper limit for the photoresponsivities of 0.336 A/W,
0.239 A/W, and 0.202 A/W for photon energies near the bandgaps of
AGNR8BN30, AGNR16BN30, and AGNR33BN30 respectively. Due to the
higher quantum efficiency of AGNRs/BN compared to AGNRs, a higher
photoresponsivity is obtained for the same input optical power of 107 W/m2.
. Our
calculations give an upper limit for the photoresponsivities of 0.336 A/W,
0.239 A/W, and 0.202 A/W for photon energies near the bandgaps of
AGNR8BN30, AGNR16BN30, and AGNR33BN30 respectively. Due to the
higher quantum efficiency of AGNRs/BN compared to AGNRs, a higher
photoresponsivity is obtained for the same input optical power of 107 W/m2.