Figure 5.8:
Temperature dependence of and transition between direct and indirect
band gaps in lead telluride.
|
![\includegraphics[width=10cm]{figures/materials/PbTe/bg_PbTe.eps}](img715.png) |
At room temperature, the band-gap is defined by the direct distance between the
valleys at the L-point of the Brillouin zone. In contrast to many other
semiconductors, the temperature dependence of this band gap is positive,
meaning that with increasing temperatures the direct band gap at the L-point
also increases. Beside the valence band maximum at the L point, there exists
another one close to  resulting in an additional indirect band gap
separated by
resulting in an additional indirect band gap
separated by
 at
at
 [258]. Reported measurement values differ only slightly, where the
band gap is given as
[258]. Reported measurement values differ only slightly, where the
band gap is given as
 [194]. The gradient
describing the temperature dependence in a linear fit is reported to be
[194]. The gradient
describing the temperature dependence in a linear fit is reported to be
 [253,234],
 [259], and
 [194]. There is a transition between
the direct and the indirect band gap at about
[194]. There is a transition between
the direct and the indirect band gap at about
 depending on the
chosen temperature dependence of the direct band gap. The indirect band gap
has a value of
depending on the
chosen temperature dependence of the direct band gap. The indirect band gap
has a value of
 which is reported to be temperature independent
[191,253].
which is reported to be temperature independent
[191,253].
Several models found in literature have been compared to collected measurement
data [255,260,261,199], as illustrated in
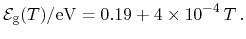
Fig. 5.8. While the ansatz proposed by Grisar [260]
delivers
 |
(5.21) |
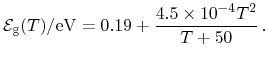
Sitter [253] proposed a simple linear fit
 |
(5.22) |
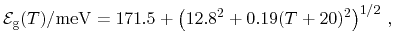
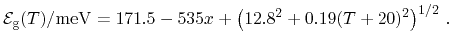
The parameters for Varshni's model [262], which is widely used in
semiconductor device simulation, have been identified in [202].
Thus, the expression for the band gap for the Varshni model reads
 |
(5.23) |
Figure 5.9:
Temperature dependence of and transition between direct and indirect
band gaps in lead tin telluride at tin contents of 0.07 and 0.15.
|
![\includegraphics[width=10cm]{figures/materials/PbTe/bg_PbSnTe.eps}](img727.png) |
In PbSnTe, the crossover between the highest valence band and the lowest
conduction band throughout a variation of the alloy composition between PbTe
and SnTe strongly affects the band gap. This results in decreasing band gap
values with increasing SnTe content for PbTe-rich samples, followed by a zero
band-gap zone, and finally approaching the SnTe value for lower temperatures.
The SnTe content for which the zero band-gap situation occurs shifts to higher
contents with increasing temperature [256]. The temperature
dependence of the band gap in tin telluride was subject of intense discussion.
While generally a slight negative temperature coefficient is suggested, the
temperature coefficient's sign is reported to change for higher carrier
concentrations [188]. However, for technologically relevant PbTe-rich
samples, this is not the case. The band gap models valid for this range are
formulated by an extension of the according PbTe models by a material
composition dependent expression. Thus, Varshni's extended model reads
 |
(5.24) |
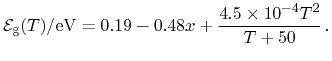
An extension to Grisar's model is obtained analogously as
 |
(5.25) |
Fig. 5.9 illustrates the situation for different material
compositions. The direct band gap is shifted to lower values with increasing
SnTe content until the band inversion occurs. Additionally, the indirect band
gap decreases due to a shift of the second valence band. The values identified
for  and
and  are
are
 and
and
 ,
respectively. Measurement data published in
[263,254,255,199,264,188,265] have
been used to identify the parameters.
,
respectively. Measurement data published in
[263,254,255,199,264,188,265] have
been used to identify the parameters.
M. Wagner: Simulation of Thermoelectric Devices