For furnace annealing processes a classical segregation approach
(4.4-5) is used to model the net dopant flux ![]() over the
interface area
over the
interface area ![]() , where
, where ![]() gives the concentration in the
monosilicon material. The total concentration at the polysilicon side of the
interface
gives the concentration in the
monosilicon material. The total concentration at the polysilicon side of the
interface ![]() is given by the grain boundary and grain interior
concentrations
is given by the grain boundary and grain interior
concentrations ![]() .
.
Additionally, the dopant absorption at the interface is captured by a
charging rate ![]() as given by (4.4-6), where d is the
thickness of the interfacial native oxide,
as given by (4.4-6), where d is the
thickness of the interfacial native oxide, ![]() the interface area
density, and
the interface area
density, and ![]() the interface trapping coefficient.
the interface trapping coefficient.
If the process temperature is sufficiently high ( ![]() ), the native
oxide breaks up and epitaxial realignment occurs. To incorporate these
phenomena, we change the interface model after the break-up time
), the native
oxide breaks up and epitaxial realignment occurs. To incorporate these
phenomena, we change the interface model after the break-up time ![]() during the diffusion process. Instead of a classical segregation/absorption
model we use a modified two stage segregation model as given by
(4.4-7) and (4.4-8).
during the diffusion process. Instead of a classical segregation/absorption
model we use a modified two stage segregation model as given by
(4.4-7) and (4.4-8).
![]() gives the lateral realignment time,
gives the lateral realignment time, ![]() is the lateral extent
of the totally realigned oxide spheres, and
is the lateral extent
of the totally realigned oxide spheres, and ![]() denotes the distance
between the single oxide sphere. During the first stage the effective
interface contact area
denotes the distance
between the single oxide sphere. During the first stage the effective
interface contact area ![]() grows until the
lateral realignment of the interface is finished. The interface oxide
spheres are fully established now and the contact area remains stable with
the lateral extend
grows until the
lateral realignment of the interface is finished. The interface oxide
spheres are fully established now and the contact area remains stable with
the lateral extend ![]() .
.
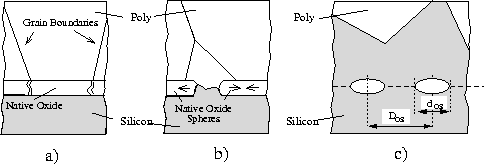
The lateral alignment is assumed to be linear during the transition of the native oxide into spheres. The detailed mechanism for the lateral regrowth of the poly-/monosilicon interface is shown in Figure 4.4-2.

Figure 4.4-2: Lateral realignment
of the native oxide layer: a) break-up, b) starting lateral realignment to
form oxide spheres, and c) final realigned oxide spheres with diameters
![]() and the distance
and the distance ![]() to next sphere.
to next sphere.
The distance between the oxide spheres is approximately the grain size of
the adjacent polysilicon grains ( ![]() ) [Spi93]. We can
deduce the lateral realignment time
) [Spi93]. We can
deduce the lateral realignment time ![]() from the realignment rate
from the realignment rate
![]() by
by ![]() . A summary of all model parameters used for
the poly-/monosilicon interface model is shown in Table 4.4-2.
. A summary of all model parameters used for
the poly-/monosilicon interface model is shown in Table 4.4-2.
| Poly-/Monosilicon Model Parameters | |||||
| | | cm/s | |||
|
Arsenic | m | 1.0 | |||
| | | cm/s | |||
|
Phosphorus | m | 1.0 | |||
| Realignment Rate | | | | | |
| Break-up Time | | | s | | |
| Interface Trapping | | | | | |
| Interface Area Density | | | |
| |
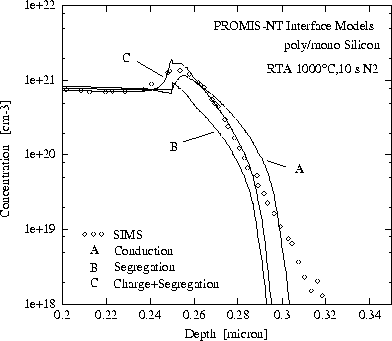
The influence of the interface model to the outdiffused portion of the dopant concentration is shown in Figure 4.4-3. Thereby three different interface model are applied for the same RTA outdiffusion experiment. The first interface model represents a conduction model with equal concentrations on both sides of the interface (see A in Fig. 4.4-3). The lower diffusivities of the dopants in the mono silicon region leads to an accumulation of dopants at the interface. As the dopants find no diffusion barrier at the interface the outdiffusion into the bulk is overestimated.

Figure 4.4-3: Comparison between different interface models for outdiffusion
experiments: A) conductive model, B) segregation model, and C)
poly-/monosilicon model.
A conventional segregation model with a segregation coefficient m = 0.5 is given by the second examined interface model (cf. B in Fig. 4.4-3). The dopant concentration changes abruptly at the interface according to the segregation kinetics. If a segregation coefficient m;SPMgt;1 is specified the profile remains flat in the polysilicon material because of the enormous dopant mobility. The high diffusivity dissolves any concentration peak within the polysilicon layer. Due to the diffusion barrier at the interface the outdiffusion is retarded compared to the conduction model.
The third model represents the poly-/monosilicon interface model, as given by (4.4-5) and (4.4-6). A segregation law in addition with dopant absorption at the interface is used to model the outdiffusion of dopants (see C in Fig. 4.4-3). The dopant pile-up at the interface is predicted quantitatively correct by this interface model.