There are a few things to note about this comparison: Since the number of cells
used for the simulation was the only information which could be extracted from
the level set reference, the comparison was made with the same number of cells
for the cellular method. This puts the level set method in advance, since it
has a higher accuracy when taking the same number of cells. A trade-off exists
for the level set method when converting the surface to a polygonal
representation, which requires mesh refinement at sharp
corners [36]. The cellular approach represents sharp corners quite
accurately with the drawback, that they might be shifted in location by
![]() half of the cell resolution.
half of the cell resolution.
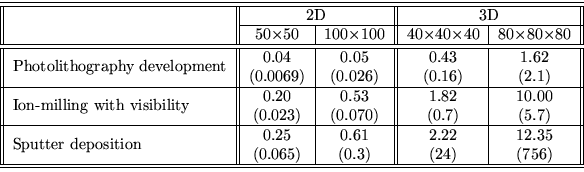
Regarding this drawback it has to be mentioned, that the figures for the cellular approach were obtained by timing a full simulation run including all necessary file reading and writing steps, geometry and material initialization functions, rate calculations and surface propagation procedures. The figures in the table were derived by dividing the resulting final CPU times by the number of time-steps which was set to either one or two. In this way the figures represent an upper limit for the core operations of the process models and include a considerable margin in CPU time for a higher accuracy. The numbers taken from the reference for the level set method account only for the surface propagation, with the time for all additional operations already subtracted.
Finally the comparison for sputter deposition contains only a fitting model for redeposition on the cellular side, less physically based than the corresponding model used for the level set method. However there is a considerable margin for a more sophisticated treatment of redeposition in the cellular model.
The comparison clearly shows, that the algorithmic optimization of the structuring element methodology with the reduction from the inherent three-dimensional scanning operations to algorithms of lower dimensionality drastically accelerates the surface propagation and makes its performance comparable with other surface propagation techniques. Within acceptable accuracy limits the CPU time for the surface propagation of the cellular algorithm can be neglected with respect to the very time consuming visibility calculations which are required by any type of topography algorithm. With the algorithmic acceleration the performance of the program is determined by the operations for checking of the visibility conditions and by the complexity of the applied process model.
![]()
![]()
![]()
![]()
Prev: 6.2.3 Sputter Deposition
Up: 6. Low-Pressure Etching and
Next: 7. High-Pressure Chemical Vapor