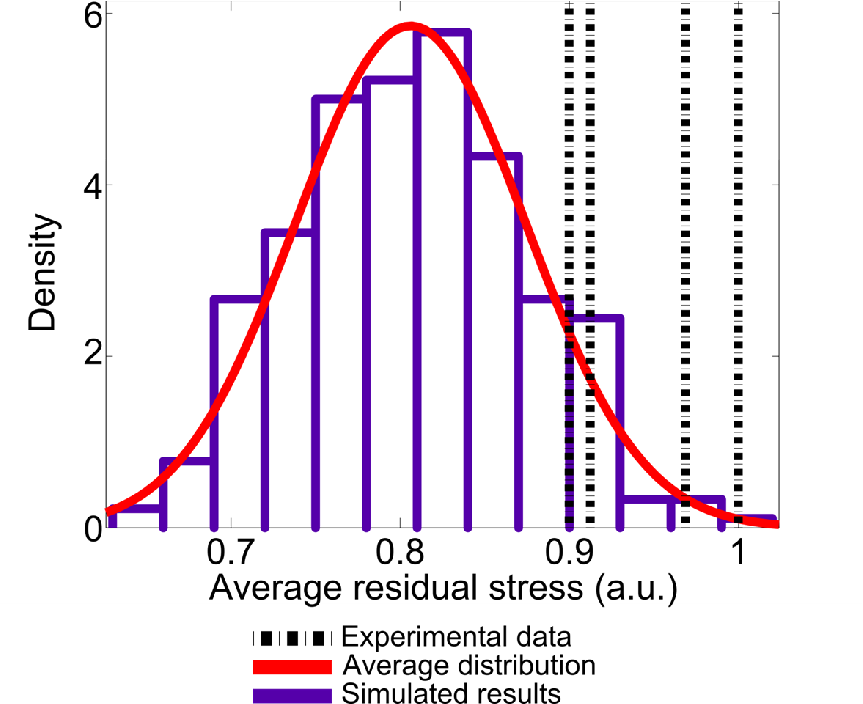
| Figure 6.13.: | Residual stress estimation. The simulated results follow a normal distribution. The mean is the residual stress estimate and the distribution spreading is the expected deviation from the estimate. |
The grain size determines the final intrinsic stress magnitude (in materials with low adatom mobility) as can be seen from Fig. 6.4. Bigger grains lead to smaller stress generation and smaller grains lead to higher stress generation [99]. The resulting grain size and distribution is affected by several processing and material parameters. However, a process engineer can control – to some extent – the grain size distribution only by the growth rate and the nucleation distribution (rate). Thus, the intrinsic stress can be engineered, in principle, solely by those two parameters. All processing steps after deposition have been neglected for this study, which may also alter the microstructure of the material (e.g. annealing). A summary of the models which discuss those processes can be found in a previous work [99].
The results obtained from the simulation were compared to the stress measurements of tungsten films (low adatom mobility material)[85] as depicted in Fig. 6.13. The mean of the distribution is the estimate for the residual stress and the distribution spreading is the expected deviation of the estimate.
There is a tendency for the experimental data to lie above the estimated average stress. This fact can be explained by a possibly undervalued nucleation distribution of the tungsten, which could lead to overestimated averages. Nevertheless, more measurements are needed to confirm this tendency. In summary, given a set of growth parameters, the presented methodology provides the most probable interval, where the average residual stress due to coalescence can lie, and the most likely value for the residual stress in low adatom mobility metal thin films. In the case of high mobility materials the compressive component after coalescence must be introduced, but the procedure remains unchanged.
The problem of residual stress estimation requires a statistical approach due to the random
character of the coalescence process. Additionally, the obtained confidence interval provides
to the engineer a safeguard for the design of the TSVs. Naturally, further improvements are
needed such as 3D simulations (VW growth and FEM), non-instantaneous island nucleation,
and variable deposition rate.
| Figure 6.13.: | Residual stress estimation. The simulated results follow a normal distribution. The mean is the residual stress estimate and the distribution spreading is the expected deviation from the estimate. |