Next: 4.4.2 High-Field Mobility for Up: 4.4 Carrier Mobility Previous: 4.4 Carrier Mobility Contents
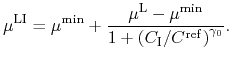
The low-field mobility is modeled by an expression similar to that proposed by Caughey and Thomas [341,138]:
 |
For GaN our model for electrons assumes the high mobility consistent with the defect-free substrates of the simulated devices (Fig. 4.10). It is calibrated against own Monte Carlo simulation results presented in Section 3.2.2. The values of the parameters for GaN and other materials are given in Table 4.7.
The model for electrons in InN is calibrated against own Monte
Carlo (Fig. 4.11) simulation results, too, described
in Section 3.3.2. The latter assumes an updated band gap of
![]() 0.7 eV and proper electron masses.
0.7 eV and proper electron masses.
While for GaN and InN experimental data exist for the transport properties, for AlN such data are hardly available as the grown AlN films are normally semi-insulating. Most authors therefore rely on MC results [342]. We verified our model against the measurements of Taniyasu et al. [343] who achieved a high mobility in Si-doped AlN. They supplemented the experimental data with simulations (Fig. 4.12). The higher maximum mobility used here is in agreement with the value proposed in [253]. It is higher than the measured values, due to our model assumption of dislocation-free conditions.
The hole transport in GaN is plagued by several doping technique issues as discussed in Section 3.2.3. Therefore, it is difficult to give a profound model. Based on the limited experimental data an initial setup is proposed (Fig. 4.13).
Due to the lack of experimental data on the transport properties of holes in InN and AlN, no corresponding parameter setups are given here. Such can be found in [342], however solely based on Monte Carlo simulations.
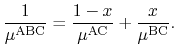
The low field mobility of alloys is calculated by a harmonic mean:
 |
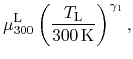
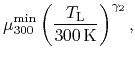
In order to model the temperature dependence, the mobilities are
parameterized using power laws [15]:
 |
|||
 |
|||
 |
Monte Carlo simulations by other groups [253,181] and
experiments [345,346] for the electron mobility in bulk GaN
as a function of the temperature are shown in
Fig. 4.14. Over the years the electron mobilities
increase due to the improved quality of the material samples. Models
proposed by other groups [175,338] are also
displayed. Fig. 4.15 shows the electron mobility as a
function of temperature in the two-dimensional electron gas as
experimentally determined by various groups
[347,348,14,179,349,350]. The mobility
exhibits overall higher values especially at high temperatures, while
retaining the trend for improved results over time. The parameter
values we chose are listed in Table 4.7. The maximum
(
![]() ) and minimum mobility (
) and minimum mobility (
![]() ) are
calibrated against own MC simulations. A decrease of the maximum
mobility with temperature (
) are
calibrated against own MC simulations. A decrease of the maximum
mobility with temperature (
![]() ), in agreement with the power
term of the acoustic phonon mobility expression [110] is
assumed. Our MC simulation results and recent experiments from
[351] confirmed that the latter is the dominant scattering
mechanism at high temperatures. A weak temperature dependence
(
), in agreement with the power
term of the acoustic phonon mobility expression [110] is
assumed. Our MC simulation results and recent experiments from
[351] confirmed that the latter is the dominant scattering
mechanism at high temperatures. A weak temperature dependence
(
![]() ) of the electron mobility at high concentrations is
adopted.
) of the electron mobility at high concentrations is
adopted.
Experimental data for the mobility dependence on temperature for InN and AlN is scarce. Therefore, the values from [342] are adopted here.
The hole mobility at different temperatures of GaN is discussed
in Section 3.2.3. Based on the experimental data, a value of
![]() is chosen which describes the decay in mobility with
higher temperature well.
is chosen which describes the decay in mobility with
higher temperature well.
![\includegraphics[width=11.0cm]{figures/models/mobility/GaNis2.eps}](img429.png)
![\includegraphics[width=11.0cm]{figures/models/mobility/InNis2.eps}](img430.png)
![\includegraphics[width=11.0cm]{figures/models/mobility/AlNis2.eps}](img431.png)
![\includegraphics[width=11.0cm]{figures/models/mobility/GaNish.eps}](img432.png)
![\includegraphics[height=0.42\textheight]{figures/models/mobility/MTBulkn.eps}](img444.png)
![\includegraphics[height=0.42\textheight]{figures/models/mobility/MTDEGnbw.eps}](img445.png)