 .
.


The terms volume rendering and volume visualization refer to techniques for displaying scalar functions of three spatial coordinates known as volume data (or volumetric data). The most general known approach to generate images from such data is to simulate the interaction of light rays with a semitransparent, absorbing and emitting material, according to linear transport theory. There is a wide variety of possible mappings of scalar function values to the optical properties of the simulated material. Almost all volume rendering techniques are covered by this general concept.
Although the primary impact of these rather new techniques has been on the visualization of intrinsically three-dimensional experimental data (generated, e.g., by nuclear magnetic resonance tomography or seismic explorations) the application to three-dimensional simulated data is no less attractive. An increasing number of volume rendering applications can also be found in traditional CAE areas, some of them even in process and device simulation [91] [90].
Most existing methods operate on data given on regular tensor-product
grids and hence have to re-sample the data if it is given on an irregular
grid. The volume rendering module of VISTA [93]
does not re-sample the
data but works directly on the tetrahedral tessellation of the volume
data, given as set of 3-simplexes,  .
.
The algorithm to obtain the intensity of the red, green, and blue
``light components'' at a given point of the resulting image is based
on the casting of a ray through the three-dimensional simplex set.
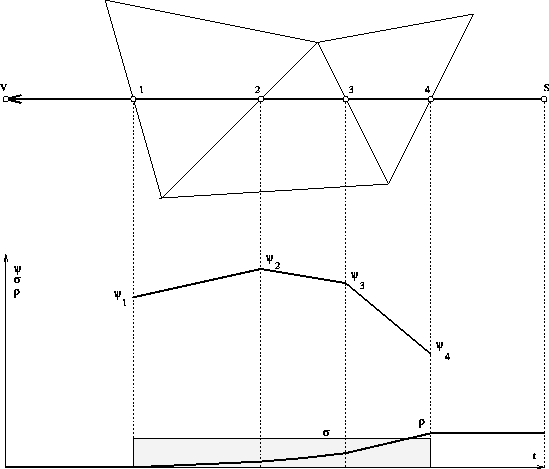
Figure 5.5 shows a simple two-dimensional equivalent.
The ray originates at a source point  in the background
where it consists of the initial components
  ,
,  ,
and
,
and  and intersects the simplex structures at
certain points (labeled 1 to 4). During the transition through the
absorbing and emitting medium the intensities are modified according to the
optical properties of this region and finally the observer
at the point
  is reached by the ray.

Figure 5.5: A ray passing through the simplexes
The light intensities of color  arriving
 at point
  is
is

where the integral is approximated as

 is the amount of C-colored light emmitted by the virtual
``fog-like'' medium.
  is the density of this
medium.
The optical parameters
  and
and  depend on the value of the
visualized quantity
  and can be chosen by the user to obtain the
desired visualization effect.

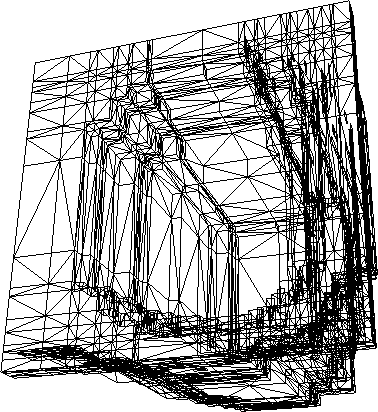
Figure 5.6: Tetrahedral  simplex set used for volume rendering

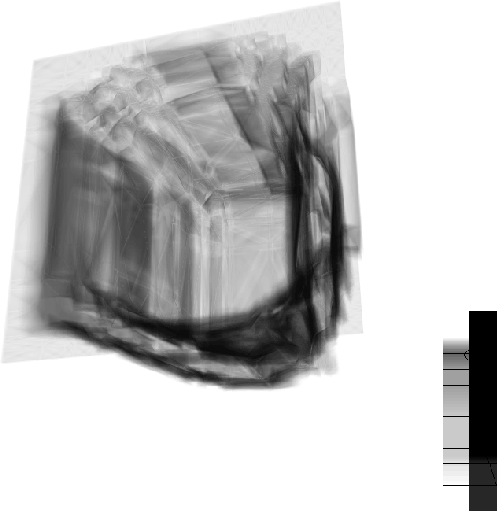
Figure 5.7: Volume-rendered image of
the doping concentration in a
three-dimensional trench structure
Figure 5.7 shows the doping concentration in a three-dimensional
trench structure that has been created by the simulation of
ion implantation with Monte Carlo
methods [94]. The resulting
volumetric data ( in PIF, the struture of the simplex set
can be seen in Figure 5.6) has been transferred into the
visualization system using an input module and the resulting
simplex set
  has been volume-rendered to create
Figure 5.7. The color
 bar on the right side shows the combined
effect of
  ,
,  ,
,  and
and  for
for
 increasing from bottom to top.


