


The idea of the VISTA visualization toolkit is to provide the user with building blocks (the operations listed in Table 5.4.1) which can be combined to perform the desired visualization task. As the process of module combination is not supported yet, a prototype application which addresses the most common visualization requirements for two-dimensional process and device simulation has been implemented.
xpif2d (X-client for the PIF-based visualization of Two-Dimensional data) is an application which reads PIF data containing geometry, grid, and attribute information and visualizes the data using one of several combinations of modules. Visualization parameters and common module combinations can be selected using pulldown menus. Zoom functions are provided by the SVG widget (Section 3.3.2) which is used by xpif2d to display the final plot.
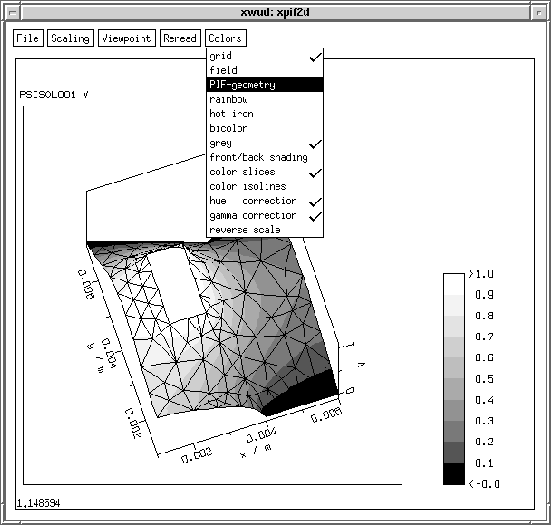
Figure 5.8: Screen dump of xpif2d
Figure 5.8 shows a screen dump of the xpif2d client. The combination of modules which led to the resulting visualization shown in Figure 5.8 is (compare Table 5.4.1)
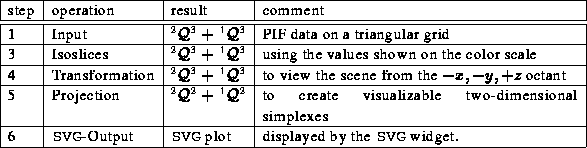
This flow of the visualization is simplified. It does not contain the generation of axes and color scale, scaling, normalization, and visibility-sort steps which are required to produce the plot shown in Figure 5.8.