6.2.3 Gate Voltage Criteria
In this section it is demonstrated that, in general, fast NBTI measurements have
to be taken with a grain of salt. This is largely due to difficulties with
synchronization between the stimulus and the actual measurement. So even when
the experiment is free of systematic synchronization errors, i.e. switching of the
gate voltage and recording of  start at the same time, the finite settling time
of real signals makes ex-post time zero adjustments necessary. Hence, the time
evolution of the actual waveform has to be checked carefully [18]. It turned out
that the pulse length is around
start at the same time, the finite settling time
of real signals makes ex-post time zero adjustments necessary. Hence, the time
evolution of the actual waveform has to be checked carefully [18]. It turned out
that the pulse length is around  longer than originally set by the pulse
generator. This factor has to be accounted for and the real stress times
longer than originally set by the pulse
generator. This factor has to be accounted for and the real stress times  of the sequences need to be extracted using the applied gate pulse. As
shown in Fig. 6.7 the pulse is affected by the transient behavior and
a possible overshoot due to the non-instantaneous switching between
of the sequences need to be extracted using the applied gate pulse. As
shown in Fig. 6.7 the pulse is affected by the transient behavior and
a possible overshoot due to the non-instantaneous switching between
 , which is applied in-between the pulses, and
  . Therefore, after
the transition regime, a steady state value of
. Therefore, after
the transition regime, a steady state value of  is determined and
set as
is determined and
set as  (usually taken at
  ). Then an error criterion, i.e.
 is employed. Since noise is apparent in
all three sequences,
is employed. Since noise is apparent in
all three sequences,  has to be chosen large enough to not disrupt
the pulse, usually in the range of
has to be chosen large enough to not disrupt
the pulse, usually in the range of  . Starting at
  and
moving as well to lower (to the beginning of the pulse) and higher (to
the end of the pulse) times sets new borders of our accepted stress time
and
moving as well to lower (to the beginning of the pulse) and higher (to
the end of the pulse) times sets new borders of our accepted stress time
 .
.
The treatment of the relaxation phase is more complex. It is argued
that the noise level is the same during stress and relaxation (the DSO
continuously records, using the same settings), and the settling time of the pulse
generator in theory is equal regardless if switching from  to
to  or
vice versa occurred. The criterion for the relaxation phase could then be
established as ‘all points extending to both sides of
or
vice versa occurred. The criterion for the relaxation phase could then be
established as ‘all points extending to both sides of  that fulfill
 ’. This effectively uses the same absolute allowed
deviation from
’. This effectively uses the same absolute allowed
deviation from  as was used during determination of the stress phase,
hence this method will be referred to as the ‘
as was used during determination of the stress phase,
hence this method will be referred to as the ‘ -criterion’. On the other hand,
the relative error in
-criterion’. On the other hand,
the relative error in  (and hence in
  ) that would erroneously be
attributed to NBTI is given by the relative deviation of
) that would erroneously be
attributed to NBTI is given by the relative deviation of  , asking for a
criterion
, asking for a
criterion  . This method, which is tighter
by a factor of
. This method, which is tighter
by a factor of  , is referred to as the ‘
 -criterion’.
Both methods were investigated thoroughly, and the relative method was
chosen.
-criterion’.
Both methods were investigated thoroughly, and the relative method was
chosen.
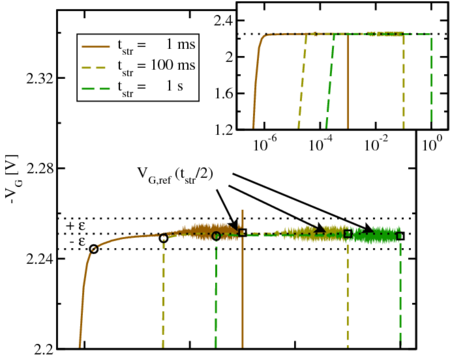
 to
to  and back. The employed error criterion
 is displayed for
  . The first (last)
proper values of the pulse for each sequence are marked by circles (squares).
The noise is apparent in all three sequences and limits
. The first (last)
proper values of the pulse for each sequence are marked by circles (squares).
The noise is apparent in all three sequences and limits  to extremely small
values.
to extremely small
values. 
 for different values of
  of
the relative and absolute truncation criterion is depicted. The logarithmic
dependence for longer relaxation times is indicated, too.
of
the relative and absolute truncation criterion is depicted. The logarithmic
dependence for longer relaxation times is indicated, too. 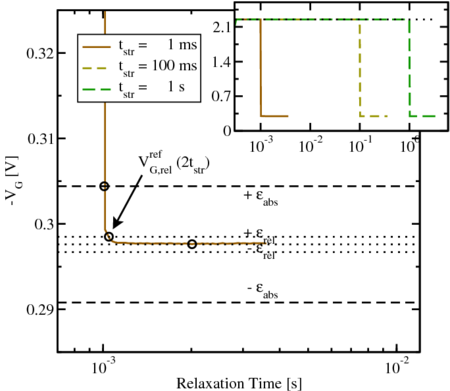
 -criterion’ and the
‘
-criterion’ and the
‘ -criterion’ are displayed for
  , with the first points of the
relaxation pulse (after
, with the first points of the
relaxation pulse (after  ) marked by circles.