|
A profound increase in ![]() can be achieved when we consider the more realist
case, in which we allow for electrons and phonons to undergo boundary scattering in
addition to phonon scattering. The
can be achieved when we consider the more realist
case, in which we allow for electrons and phonons to undergo boundary scattering in
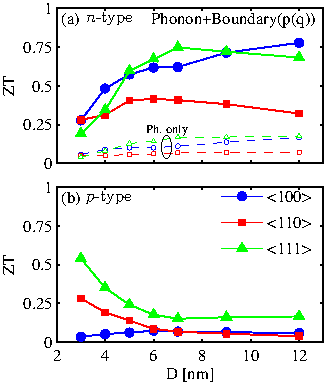
addition to phonon scattering. The ![]() figure of merit in this case is shown in Fig. 6.3, (Fig.6.3-a for
figure of merit in this case is shown in Fig. 6.3, (Fig.6.3-a for ![]() -type nanowires and Fig. 6.3-b for
-type nanowires and Fig. 6.3-b for ![]() -type nanowires). The anisotropy, and the main features observed with diameter scaling are not altered significantly compared to Fig. 6.2.
-type nanowires). The anisotropy, and the main features observed with diameter scaling are not altered significantly compared to Fig. 6.2. ![]() , however, increases by almost a factor of
, however, increases by almost a factor of
![]() with the introduction of boundary scattering, both for
with the introduction of boundary scattering, both for ![]() -type and
-type and ![]() -type nanowires (the phonon-scattering only results of Fig. 6.2-a are shown in Fig. 6.3-a for reference).
-type nanowires (the phonon-scattering only results of Fig. 6.2-a are shown in Fig. 6.3-a for reference). ![]() varies from
varies from ![]() to
to ![]() for
for ![]() -type nanowires (
-type nanowires (
![]() at larger diameters), also in agreement with other theoretical studies [145]. For
at larger diameters), also in agreement with other theoretical studies [145]. For ![]() -type nanowires it reaches a maximum of
-type nanowires it reaches a maximum of
![]() for the
for the
![]() nanowires of smaller diameters.
nanowires of smaller diameters.
This increase in ![]() indicates that the boundary scattering reduces the thermal
conductivity by a factor of
indicates that the boundary scattering reduces the thermal
conductivity by a factor of
![]() more than it reduces the power factor. As explained in Ref. [143], the introduction of surface roughness (SR) scattering, degrades the electrical conductivity significantly, but improves the Seebeck coefficient slightly. The degradation in the power factor, therefore, is dominated by the decrease in the electrical conductivity. Fig. 6.3 shows, however, that even in geometries with ultra-small feature sizes, in which the electrical conductivity is strongly degraded due to enhanced electron-phonon and electron-SR scattering, the thermal conductivity even stronger degrads. It suggests that phonon engineering techniques that further increase phonon scattering can help in the improvement of
more than it reduces the power factor. As explained in Ref. [143], the introduction of surface roughness (SR) scattering, degrades the electrical conductivity significantly, but improves the Seebeck coefficient slightly. The degradation in the power factor, therefore, is dominated by the decrease in the electrical conductivity. Fig. 6.3 shows, however, that even in geometries with ultra-small feature sizes, in which the electrical conductivity is strongly degraded due to enhanced electron-phonon and electron-SR scattering, the thermal conductivity even stronger degrads. It suggests that phonon engineering techniques that further increase phonon scattering can help in the improvement of ![]() . This was considered to be the case for nanowires of larger diameters [20], but it appears to be the case also for nanowire diameters as thin as a few nanometers.
. This was considered to be the case for nanowires of larger diameters [20], but it appears to be the case also for nanowire diameters as thin as a few nanometers.