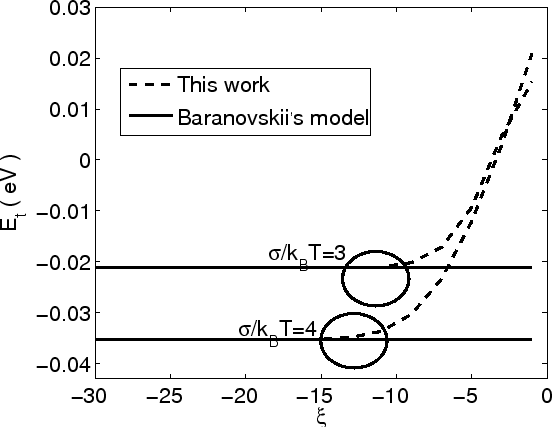
Calculation of transport energy versus the normalized chemical
potential ![]() is given for different DOS standard deviation in Fig 3.2 with
parameters
is given for different DOS standard deviation in Fig 3.2 with
parameters
|
|
|
|
 a
a
 b
b
|
As expected, for a very low chemical potential level (very low carrier concentration), the two models agree very well. However, when the chemical potential goes up and thus the concentration increases, the transport energy considering Fermi statistics will increase as well, while in the Baranovskii model the transport energy is independent on the chemical potential. Baranovskii's model of the transport energy can only be used when the carrier concentration is low enough.
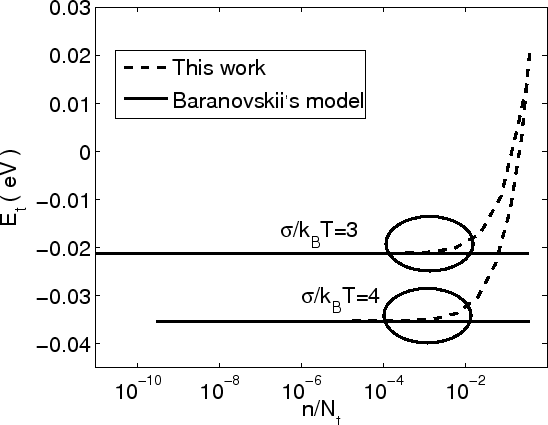
The dependence of the transport energy on the relative carrier concentration
(![]() ) can be seen in Fig 3.3. The transport energy increases at a
relative carrier concentration of about
) can be seen in Fig 3.3. The transport energy increases at a
relative carrier concentration of about
![]() .
.
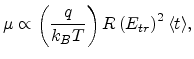
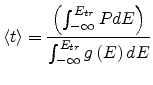
For the calculation of the hopping mobility [78], the relaxation time
![]() is important, which can be calculated as
is important, which can be calculated as
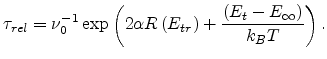 |
(3.10) |
 |
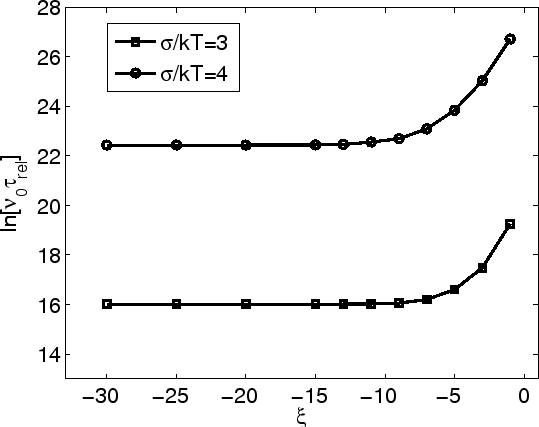
We plot the relation between
![]() and the carrier concentration in Fig 3.4 with parameters
and the carrier concentration in Fig 3.4 with parameters
![]() cm
cm![]() and
and
![]() Å. We can see that the
relaxation time is constant when the chemical potential is low enough, but it
increases for
Å. We can see that the
relaxation time is constant when the chemical potential is low enough, but it
increases for ![]() for our case.
for our case.
We apply the calculated transport energy to the problem of charge mobility in organic semiconductors. Using the Einstein relation we obtain [78]
 |
(3.11) |
 |
(3.12) |
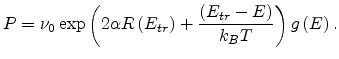 |
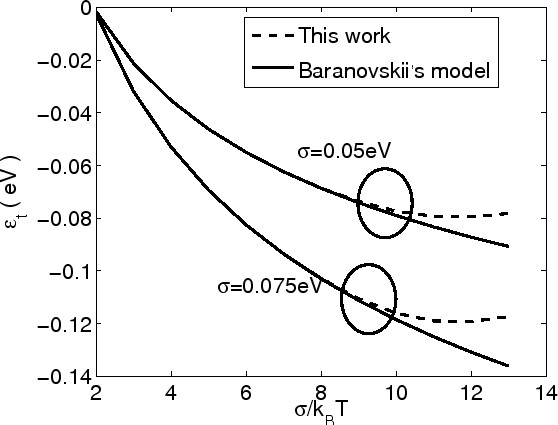
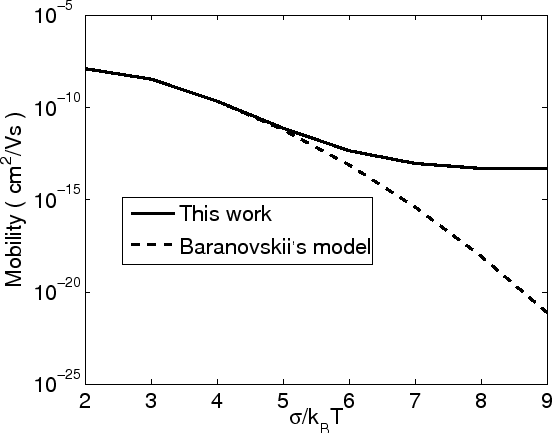
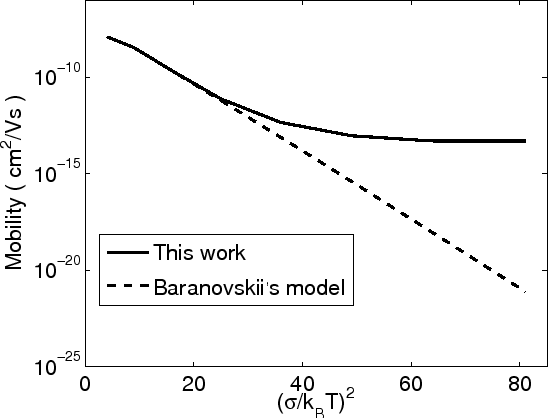
Fig 3.5 compares the temperature dependence of the carrier mobility as
obtained from our model and Baranovskii's model. The input parameters are
![]() cm
cm![]() ,
,
![]()
![]() and
and ![]()
![]() T.
The graph
T.
The graph ![]() versus
versus
![]() and
and ![]() versus
versus ![]() are plotted in Fig 3.5 (a) and
(b). Our model can describe a deviation from straight. In fact, at higher temperature, the mobility is
controlled by jumps of carriers that occupy intrinsic sites, so that the occurrence
of the traps does not change the linear relation
between
are plotted in Fig 3.5 (a) and
(b). Our model can describe a deviation from straight. In fact, at higher temperature, the mobility is
controlled by jumps of carriers that occupy intrinsic sites, so that the occurrence
of the traps does not change the linear relation
between ![]() versus
versus ![]() . At lower temperature, the traps in organic
semiconductors play a more important role for charge transport [68].
. At lower temperature, the traps in organic
semiconductors play a more important role for charge transport [68].
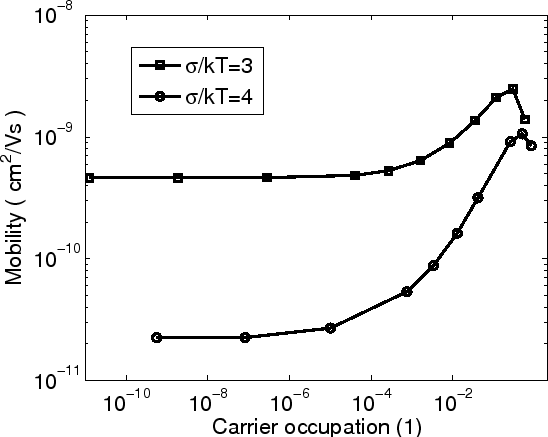
In Fig 3.6 we plot the relation between
the mobility and the carrier concentration. The
input parameters are
![]() cm
cm![]() ,
,
![]() s
s![]() and
and
![]() .
.
It is illustrated that the mobility remains constant when the carrier concentration is very low. However, it will increase when the carrier concentration is above a critical value. This result coincides with experimental data given in [79] and recent work given in [80].