3.3 Band Structure Model
Figure 3.4:
Equi-energy surfaces of the full band structure of silicon within
one octant of the first Brillouin zone.
|
![\includegraphics[width=12cm]{figures/materials/brillouin/band4_complete.eps}](img234.png) |
Generally, the full band structure of semiconductors incorporates an
anisotropic dispersion relation
 , which is only accessible by
numerical methods. Fig. 3.4 illustrates iso-energy surfaces of the
first conduction band of silicon within one octant of the Brillouin zone,
where the lowest energy minima are located close to the
, which is only accessible by
numerical methods. Fig. 3.4 illustrates iso-energy surfaces of the
first conduction band of silicon within one octant of the Brillouin zone,
where the lowest energy minima are located close to the  -points. Around
these energy minima valleys are formed, whose shape deviates strongly from the
conventionally used elliptic approximation with increasing energies. Beside
the valleys at the
-points, further valleys are located at the
-points. Around
these energy minima valleys are formed, whose shape deviates strongly from the
conventionally used elliptic approximation with increasing energies. Beside
the valleys at the
-points, further valleys are located at the  -points,
whose energy minima are higher than that of the
-valleys. However, in
order to describe the transport in the semiconductor in a closed analytical
way, simplified expressions for the rather complicated full-band structure are
commonly introduced. In the following derivations, isotropic bands are
assumed, which imply the dispersion relation to depend only on the magnitude of
the wave vector
-points,
whose energy minima are higher than that of the
-valleys. However, in
order to describe the transport in the semiconductor in a closed analytical
way, simplified expressions for the rather complicated full-band structure are
commonly introduced. In the following derivations, isotropic bands are
assumed, which imply the dispersion relation to depend only on the magnitude of
the wave vector
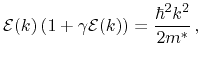
 . For the sake of convenience, the dispersion relation
is separated into its parabolic and non-parabolic contributions
[76]
. For the sake of convenience, the dispersion relation
is separated into its parabolic and non-parabolic contributions
[76]
 |
(3.12) |
with the non-parabolicity function
 and the isotropic carrier mass
 . The simplest band structure model is the parabolic one, which is
obtained for
. The simplest band structure model is the parabolic one, which is
obtained for
 as
as
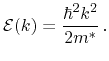 |
(3.13) |
However, the validity of the parabolic band model is restricted to low carrier
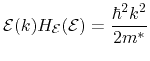
energies. In order to address higher energies, the non-parabolicity of the
band structure has to be taken into account by appropriate expressions for
. Kane proposed a first-order correction [77] in the form
 |
(3.14) |
whose validity is limited to energies below
 in silicon
[73]. In order to accurately describe the dispersion relation
for even higher energies, more sophistic models can be applied, such as
tabulated data for
obtained from numerical band structure
calculations. However, the carriers in thermoelectric devices as investigated
in this work are not driven far from equilibrium and thus the band structure is
described by the parabolic expression (3.13) in the following
derivations of transport models.
in silicon
[73]. In order to accurately describe the dispersion relation
for even higher energies, more sophistic models can be applied, such as
tabulated data for
obtained from numerical band structure
calculations. However, the carriers in thermoelectric devices as investigated
in this work are not driven far from equilibrium and thus the band structure is
described by the parabolic expression (3.13) in the following
derivations of transport models.
M. Wagner: Simulation of Thermoelectric Devices