7.2 Reflective Symmetries

The templated mesh generation of objects with reflective symmetries utilizes an implementation based on the algorithms presented in Section 6.2 and Section 6.4.1. In particular, the mesh generation software tools Triangle and Tetgen are used to generate a multi-region triangular and tetrahedral mesh from which the mesh templates are extracted; no special care has to be taken to ensure interface conformity of the structure instance (cf. Lemma 6.1 and Lemma 6.2).

Benchmarks of three example objects with reflective symmetries are presented:
(i)
A 2D aircraft with one reflective symmetry (Figure 7.1a).
(ii)
A 2D MOSFET [62] with one reflective symmetry (Figure 7.1c).
(iii)
A 3D FinFET [43] with two reflective symmetries (Figure 7.1e).

Figure 7.1: Benchmark objects with reflective symmetries and their templates


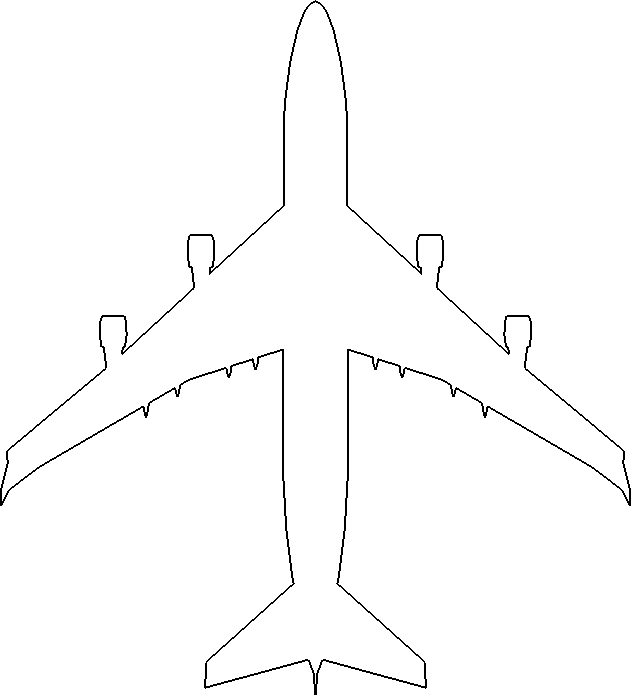
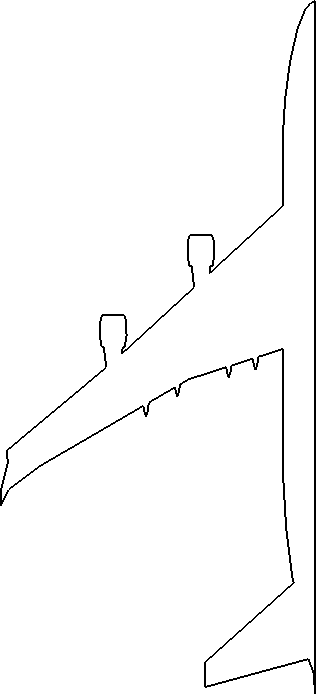
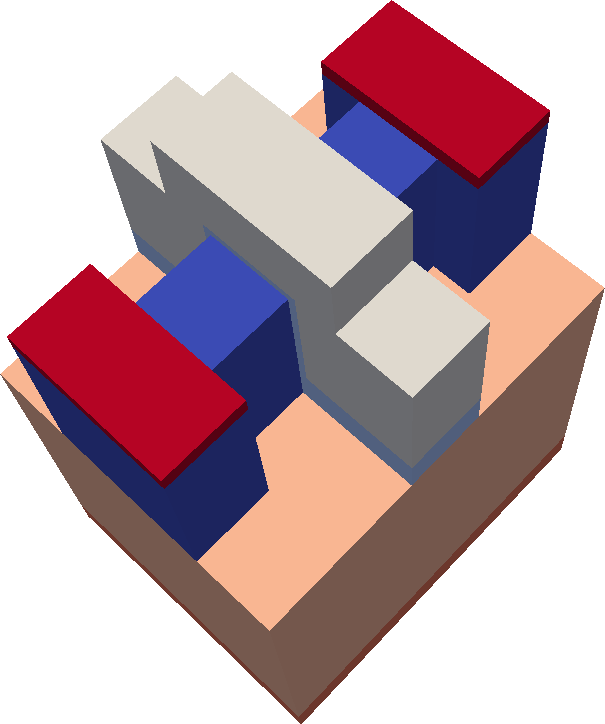
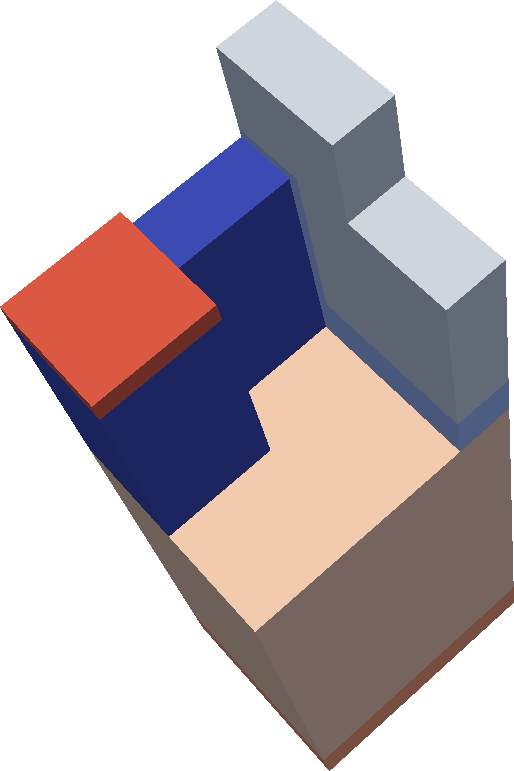
The aircraft (top pictures) and the 2D MOSFET (middle pictures) have one reflective symmetry with a vertical reflecting hyperplane. The 3D FinFET (bottom pictures) has two reflective symmetries with reflecting hyperplanes which are orthogonal to each other. While the aircraft geometry does not have any regions, the 2D MOSFET and the 3D FinFET geometry have multiple regions (indicated by different colors) which reflect different material properties.

The benchmark results for these three structures are shown in Figure 7.2. It can be seen that the runtime speedups for small cell counts are at most moderate. For the aircraft and the MOSFET, a cell count of at least $ 10^4$ is required for the templated approach to be as fast as the conventional approach. It can also be seen that low cell counts result in a quite unstable runtime speedup behavior for the aircraft due to the fast underlying Triangle software for low cell counts. However, for high cell counts, the runtime speedups converge to the expected savings (cf. Section 6.2 and Section 6.4.1), which is a factor of two for the 2D aircraft and the 2D MOSFET and a factor of four for the 3D FinFET.

Regarding the memory savings, the behavior is similar. The memory savings are moderate for small cell counts. However, for large cell counts, a convergence to the expected memory savings is observed. Memory savings of nearly two ($ 1.9$ and higher) are achieved for aircraft meshes with cell counts larger than $ 10^4$ using the templated data structure without SVB (cf. Section 4.5) and for cell counts larger than $ 10^5$ using the templated data structure with SVB. Memory savings larger than the expected memory savings can be observed for the 2D MOSFET and the 3D FinFET. The reason for these high memory savings is the conventional multi-region mesh data structure @MRMESH@: The region identifier is stored for each cell while in the templated data structures, only one region identifier is required for a mesh template rather than for each cell. Therefore, for the 2D MOSFET, cell counts larger than $ 4 \times 10^4$ and $ 4 \times 10^3$ results in memory savings larger than two using the templated data structure with and without SVB, respectively. For the 3D FinFET, cell counts larger than $ 5 \times 10^6$ and $ 4 \times 10^5$ result in memory savings larger than four using the templated data structure with and without SVB, respectively.

Figure 7.2: Benchmark results for objects with reflective symmetries

\begin{subfigure}
% latex2html id marker 15170
[b]{0.48\textwidth}
\centering
...
...enchmark/aircraft_time}
\caption{Runtime speedups 2D aircraft}
\end{subfigure} \begin{subfigure}
% latex2html id marker 15176
[b]{0.48\textwidth}
\centering
...
.../benchmark/aircraft_size}
\caption{Memory savings 2D aircraft}
\end{subfigure}


\begin{subfigure}
% latex2html id marker 15184
[b]{0.48\textwidth}
\centering
...
...benchmark/mosfet_2d_time}
\caption{Runtime speedups 2D MOSFET}
\end{subfigure} \begin{subfigure}
% latex2html id marker 15190
[b]{0.48\textwidth}
\centering
...
...s/benchmark/mosfet_2d_size}
\caption{Memory savings 2D MOSFET}
\end{subfigure}


\begin{subfigure}
% latex2html id marker 15198
[b]{0.48\textwidth}
\centering
...
...benchmark/finfet_3d_time}
\caption{Runtime speedups 3D FinFET}
\end{subfigure} \begin{subfigure}
% latex2html id marker 15204
[b]{0.48\textwidth}
\centering
...
...s/benchmark/finfet_3d_size}
\caption{Memory savings 3D FinFET}
\end{subfigure}

The left and right column shows runtime and memory benchmarks, respectively, for different objects and for varying cell counts. Expected savings (visualized by the green lines) are a factor two for the 2D aircraft and 3D MOSFET (both having one reflective symmetry) and a factor of four for the 3D FinFET (having two reflective symmetries).

Until now, memory savings are calculated using a conventionally generated mesh and a templated mesh, both generated with the same parameters. Memory savings of a templated mesh and its structure instance are visualized in Figure 7.3. It can be seen, that the qualitative behavior is the same as the memory savings of a templated mesh and a conventionally generated mesh with the same parameters (cf. Figure 7.2).

Figure 7.3: Memory benchmark results of structure instance

\begin{subfigure}
% latex2html id marker 15219
[b]{0.48\textwidth}
\centering
...
...nchmark/aircraft_size_SI}
\caption{Memory savings 2D aircraft}
\end{subfigure}

\begin{subfigure}
% latex2html id marker 15225
[b]{0.48\textwidth}
\centering
...
...enchmark/mosfet_2d_size_SI}
\caption{Memory savings 2D MOSFET}
\end{subfigure}


\begin{subfigure}
% latex2html id marker 15233
[b]{0.85\textwidth}
\centering
...
...enchmark/finfet_3d_size_SI}
\caption{Memory savings 3D FinFET}
\end{subfigure}

In contrast to Figure 7.2 memory savings of the templated mesh are calculated based on the memory requirement of its structure instance rather than a (non-symmetric) conventionally generated mesh of the same geometry. The expected savings are visualized by green lines.

Figure 7.4: Element quality issues due to sharp angles in the 2D aircraft geometry

Figure: Element qualities

\begin{subfigure}[b]{0.99\textwidth}
\centering
\includegraphics[width=0.99\textwidth]{figures/meshed_aircraft_high_quality}
\end{subfigure}


\begin{subfigure}
% latex2html id marker 15257
[b]{0.48\textwidth}
\centering
...
...ft_hist_symmetric}
\caption{Quality histogram, symmetric mesh}
\end{subfigure}

\begin{subfigure}
% latex2html id marker 15263
[b]{0.48\textwidth}
\centering
...
...aircraft_hist}
\caption{Quality histogram, non-symmetric mesh}
\end{subfigure}

The mesh has been generated with a desired smallest angle of $ 30\degree$. However at the wing and the end of the aircraft this element quality constraint cannot be achieved due to sharp angles in the input geometry (top picture). All other elements fulfill the desire element quality. The smallest angle quality histograms of the symmetric mesh (middle picture) and non-symmetric mesh (bottom picture) show, that for the non-symmetric mesh slightly more elements have a quality worse than configured (visualized by the red bins). The histogram bins are given in log scale for better visualization of the bad quality bins.

As discussed in Section 5.1, a potential issue regarding templated mesh generation is the resulting mesh quality. To obtain high quality meshes, the corresponding mesh quality parameters of the mesh generation software are used to obtain a mesh with a specific minimal quality. For the 2D objects, being the aircraft and the MOSFET, smallest angles of $ 5\degree, 10\degree, 20\degree$, and $ 30\degree$ have been used as quality meshing parameters. All elements of the resulting conventionally generated meshes as well as the corresponding structure instances of all 2D MOSFET benchmarks have smallest angles larger or equal than the configured value and therefore meet the desired element quality constraints. However, the mesh generation algorithm was unable to meet the desired overall element quality for the 2D aircraft due to sharp angles in the input geometry leading to particularly bad elements (cg. Figure 7.4).


Table 7.1: Element quality analysis of 3D FinFET benchmarks. The quality measure is given in the first column. A minimal dihedral angle quality measure is indicated by A and a radius-edge ratio quality measure is indicated by R. The relative worst value colored in red indicates elements with poor element quality in the structure instance. One single cell (located in the thin channel area) in the mesh template of that particular benchmark has a radius-edge ratio larger than $ 2.87$ (the worst radius-edge ratio of the conventionally generated mesh).
Quality measure Cell size Configured quality Relative count of elements with quality worse than configured (conventionally generated mesh) Relative count of elements with quality worse than configured (structure instance) Worst quality (conventionally generated mesh) Worst quality (structure instance) Relative worst value (structure instance)
A $ 0.5$ $ 6.0\degree$ $ \num{0.0e+0}$ $ \num{8.75e-07}$ $ 6.0\phantom{0}\degree$ $ 5.48\degree$ $ 0.91$
R $ 1024.0$ $ 1.5\phantom{\degree}$ $ \num{2.82e-4}$ $ \num{5.21e-04}$ $ 1.53\phantom{\degree}$ $ 1.57\phantom{\degree}$ $ 1.05$
R $ 16.0$ $ 1.5\phantom{\degree}$ $ \num{3.04e-05}$ $ \num{1.11e-04}$ $ 1.56\phantom{\degree}$ $ 1.73\phantom{\degree}$ $ 1.16$
R $ 8.0$ $ 1.5\phantom{\degree}$ $ \num{1.97e-05}$ $ \num{4.93e-05}$ $ 1.59\phantom{\degree}$ $ 1.58\phantom{\degree}$ $ 1.05$
A $ 2.0$ $ 12.0\degree$ $ \num{0.0e+0}$ $ \num{3.03e-06}$ $ 12.0\phantom{0}\degree$ $ 11.58\degree$ $ 0.97$
R $ 1.0$ $ 2.0\phantom{\degree}$ $ \num{3.16e-06}$ $ \num{5.27e-06}$ $ 2.13\phantom{\degree}$ $ 2.02\phantom{\degree}$ $ 1.01$
R $ 1.0$ $ 1.5\phantom{\degree}$ $ \num{1.65e-05}$ $ \num{1.90e-05}$ $ 1.76\phantom{\degree}$ $ 1.74\phantom{\degree}$ $ 1.16$
R $ 32.0$ $ 1.5\phantom{\degree}$ $ \num{4.75e-05}$ $ \num{1.31e-04}$ $ 1.65\phantom{\degree}$ $ 1.67\phantom{\degree}$ $ 1.11$
R $ 4.0$ $ 1.5\phantom{\degree}$ $ \num{2.92e-05}$ $ \num{4.59e-05}$ $ 1.59\phantom{\degree}$ $ 1.55\phantom{\degree}$ $ 1.03$
R $ 256.0$ $ 2.5\phantom{\degree}$ $ \num{0.0e+0}$ $ \num{2.09e-04}$ $ 2.5\phantom{0\degree}$ $ 2.51\phantom{\degree}$ $ 1\phantom{.00}$
R $ 1.0$ $ 2.5\phantom{\degree}$ $ \num{1.35e-06}$ $ \num{5.29e-06}$ $ 2.87\phantom{\degree}$ $ 3.68\phantom{\degree}$ $ \color{red}1.47$
R $ 64.0$ $ 1.5\phantom{\degree}$ $ \num{1.22e-4}$ $ \num{1.49e-04}$ $ 1.73\phantom{\degree}$ $ 1.54\phantom{\degree}$ $ 1.03$
R $ 128.0$ $ 1.5\phantom{\degree}$ $ \num{1.21e-4}$ $ \num{2.12e-04}$ $ 1.56\phantom{\degree}$ $ 1.68\phantom{\degree}$ $ 1.12$
R $ 4.0$ $ 2.0\phantom{\degree}$ $ \num{3.49e-06}$ $ 6.7\phantom{0} \times 10^{-6}$ $ 2.08\phantom{\degree}$ $ 2.03\phantom{\degree}$ $ 1.01$


Smallest dihedral angles of $ 6\degree, 12\degree$, and $ 18\degree$ and radius-edge ratios of $ 2.5, 2$, and $ 1.5$ are used as quality meshing parameters for the 3D FinFET. However, the mesh generation algorithm is not able to fulfill these required mesh quality settings for all benchmarks. Out of $ 72$ different configurations of mesh generation parameters, $ 23$ conventionally generated meshes and $ 14$ templated mesh structure instances did not fulfill the quality parameters. The quality benchmark results of all benchmarks, where the quality of the structure instance is worse than the quality of the conventionally generated mesh, are given in Table 7.1. It can be seen, that the worst element quality value for most benchmarks is at most $ 16$% worse than the configured value. Only for one benchmark (indicated in red), the worst element quality value is off by $ 47$%. However, in this extreme case, the number of elements with worse quality than configured is less than $ 5 \times 10^{-6}$; considering all benchmarks it is even less than $ 0.5\%$ elements. Therefore, the mesh quality of the templated approach is considered as good as the quality of conventionally generated meshes for the most cases and minimally worse otherwise.

florian 2016-11-21