


Next: 4.3 Capacitance-Voltage Characteristics
Up: 4. Characterization of Interfaces
Previous: 4.1 Charge Pumping Method
4.2 DCIV Method
Another experimental method for the investigation of the interface quality is
the direct-current current-voltage (DCIV) method. It can be used to determine
both the interface trap density
 and the amount of fixed oxide charges
 .
.
Figure 4.10:
Configuration of the DCIV measurement. The source and drain to
substrate diodes are slightly forward biased. As the gate to substrate
voltage
 is swept, a current at the substrate contact can be measured.
|
|
The experimental set-up is illustrated in Figure 4.10. The source
and drain to substrate diodes are slightly forward biased, typically with
around
 V. The gate bias is swept from
inversion to slight accumulation. During this sweep the substrate current
V. The gate bias is swept from
inversion to slight accumulation. During this sweep the substrate current
 is measured. The substrate current originates from recombination of
carriers at the
is measured. The substrate current originates from recombination of
carriers at the
 interface.
Figure 4.11:
DCIV currents after different stress times. With increasing
interface degradation the maximum
 increases. The shift of the peak
position to lower voltage indicates fixed oxide or interface charges. Data
are from Zhu et al. [45].
increases. The shift of the peak
position to lower voltage indicates fixed oxide or interface charges. Data
are from Zhu et al. [45].
|
|
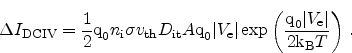
For each degradation level there is a clear peak of
at a certain
 , as shown in Figure 4.11. The peak height above the base
line,
, as shown in Figure 4.11. The peak height above the base
line,
 is approximately proportional to the effective interface
trap density
as [46,47]
is approximately proportional to the effective interface
trap density
as [46,47]
 |
(4.7) |
Here,
 is the elementary charge,
 the intrinsic carrier
concentration,
the intrinsic carrier
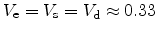
concentration,  the geometric mean of the capture cross sections for
electrons and holes, equal to
the geometric mean of the capture cross sections for
electrons and holes, equal to
 ,
,
 the thermal velocity,
  the effective gate area,
 the forward
bias applied to the source-substrate and drain-substrate junctions,
the forward
bias applied to the source-substrate and drain-substrate junctions,
 Boltzmann's constant, and
  the temperature.
To determine
, the oxide charge density, the peak position of the DCIV
curve can be used. As described in Section 2.2.1, the peak
position is directly proportional to the amount of oxide charges and can be
calculated using Equation 2.31.
Next: 4.3 Capacitance-Voltage Characteristics
Up: 4. Characterization of Interfaces
Previous: 4.1 Charge Pumping Method
R. Entner: Modeling and Simulation of Negative Bias Temperature Instability
![\includegraphics[width=10cm]{figures/dciv-schematic}](img393.png)
![\includegraphics[width=\figwidth]{figures/zhu05b-dciv}](img396.png)