3.4 Empirical Potential Molecular Dynamics
Molecular dynamics has been established as a powerful tool for the generation of
amorphous structures [151, 152]. It can simulate the time evolution of a
group of atoms at a certain temperature, where the bonding between atoms
is mimicked by interatomic empirical potentials. Even though it performs
considerably fast, the simulation times are still restricted to a few thousand
picoseconds [153, 154, 155, 156]. For this reason, empirical potential molecular
dynamics is not capable of simulating the processing of  -
- . Nevertheless, a
combination of experimental and theoretical investigations have shown that realistic
amorphous structures [151, 152] can be produced by cooling down a random
configuration of silicon and oxygen atoms from
. Nevertheless, a
combination of experimental and theoretical investigations have shown that realistic
amorphous structures [151, 152] can be produced by cooling down a random
configuration of silicon and oxygen atoms from  to room temperature within
a few tens of a picosecond. It has been found [151, 152, 153, 155] that
to room temperature within
a few tens of a picosecond. It has been found [151, 152, 153, 155] that  -
- is
composed of slightly deformed tetrahedral
is
composed of slightly deformed tetrahedral  units with one
  atom in
their centers. These units are randomly connected to each other so that
they form
atom in
their centers. These units are randomly connected to each other so that
they form  -
- -
- chains at their corners. In this way, each silicon atom
is fourfold coordinated to oxygen atoms and each oxygen atom in turn is
bonded to two silicon atoms. The distributions of the
chains at their corners. In this way, each silicon atom
is fourfold coordinated to oxygen atoms and each oxygen atom in turn is
bonded to two silicon atoms. The distributions of the  ,
,  , and
, and
 bond lengths as well as the
  and
and  angles have
been used in the following to check the quality of the generated
angles have
been used in the following to check the quality of the generated  -
- structures.
3.4.1 Fundamentals of Molecular Dynamics
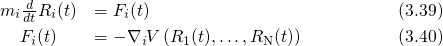
The atomistic dynamics are accurately described by Newton’s law of motion, which is
applied for classical molecular dynamics [157].
 and
and  denotes the position and the mass of atom
  . The term on the
right-hand side of equation (3.39) represents the force
. The term on the
right-hand side of equation (3.39) represents the force  acting on the atom
  and is evaluated by the derivative of the interatomic empirical potential
 with respect to
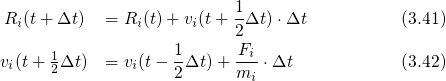
  . This differential equation is solved
numerically using an appropriate time integration algorithm, such as the leap-frog
Verlet algorithm. In this procedure, the current positions
. This differential equation is solved
numerically using an appropriate time integration algorithm, such as the leap-frog
Verlet algorithm. In this procedure, the current positions  and the accelerations
  are
stored together with the mid-step velocities
are
stored together with the mid-step velocities  . The structure generation
method used in this thesis is based on a rapid quench of a molten atomic system.
Therefore, a thermostat is required to control the temperature of the atomic system
during the quenching procedure. For this purpose, the Nose-Hoover thermostat [157]
as implemented in the GULP code was employed throughout this thesis. It relies on a
sophisticated method to couple the atomic system to a heat bath with the desired
temperature. Since this method correctly produces the thermodynamical temperature
fluctuations as well as the dynamics of the atomic system, the Nose-Hoover
thermostat is usually considered as the working horse for molecular dynamics
simulations.
. The structure generation
method used in this thesis is based on a rapid quench of a molten atomic system.
Therefore, a thermostat is required to control the temperature of the atomic system
during the quenching procedure. For this purpose, the Nose-Hoover thermostat [157]
as implemented in the GULP code was employed throughout this thesis. It relies on a
sophisticated method to couple the atomic system to a heat bath with the desired
temperature. Since this method correctly produces the thermodynamical temperature
fluctuations as well as the dynamics of the atomic system, the Nose-Hoover
thermostat is usually considered as the working horse for molecular dynamics
simulations.
3.4.2 Procedure for Structure Generation
The silicon and oxygen atoms were randomly placed in the periodic simulation cells.
In order to avoid any overlapping between the atoms, exclusion radii ( ,
,
 ,
,  ) were used. The edge length of the simulation cells
(
) were used. The edge length of the simulation cells
( ) was chosen to match a mass density of
  [155]. The resulting
random structures were taken as a starting configuration for the subsequent
molecular dynamics equilibration step, which was performed at
[155]. The resulting
random structures were taken as a starting configuration for the subsequent
molecular dynamics equilibration step, which was performed at  for
for
 with a time step of
  . In this step the atomic structure is evolved
from an unnatural random configuration to a liquid that should resemble
molten
. In this step the atomic structure is evolved
from an unnatural random configuration to a liquid that should resemble
molten  . It was followed by a quenching step to
  for
for  with
a time step of
with
a time step of  , where the liquid was cooled down to an amorphous
solid.
, where the liquid was cooled down to an amorphous
solid.
The simulations were performed using the popular Beest-Kramer-van Santen (BKS)
potential [158]. This consists of Buckingham potentials, which were extended by a
Coulombic term and parametrized to reproduce the interatomic interactions obtained
from DFT. These two-body potentials feature artificial singularities at their origins
and small separating barriers to the next energy minimum. But since the structures
were not heated above  , corrections within a certain cut-off radii as applied
in [159] could be omitted. The interatomic interactions were only represented by
, corrections within a certain cut-off radii as applied
in [159] could be omitted. The interatomic interactions were only represented by
 -
- and
and  -
- pair-potentials that describe the
  -
- bonding and
ensure the tetrahedral arrangement. Despite these strong simplifications, a
series of studies have proven their successful application for
bonding and
ensure the tetrahedral arrangement. Despite these strong simplifications, a
series of studies have proven their successful application for  structure
generation [158, 159, 152, 151].
structure
generation [158, 159, 152, 151].
In order to prove the correctness of the applied production procedure, the obtained
samples were evaluated based on the pair-correlation functions and angle
distributions as shown in Fig. 3.5 and 3.6. Due to the fact that edge-sharing
tetrahedra are energetically unfavored [152], only samples containing none of these
edge-sharing tetrahedra were used for further investigations while the others were
simply discarded. The remaining samples exhibited no miscoordination, such as
broken  -
- bonds or threefold coordinated
  atoms. As demonstrated in
Table 3.1, satisfying agreement has been achieved with previously published
results [152, 153, 155]. The selected structures were minimized on a DFT level in
order to prepare them for the following defect calculations. During this step, a
small structural relaxation was observed indicating that no bonds had been
broken.
atoms. As demonstrated in
Table 3.1, satisfying agreement has been achieved with previously published
results [152, 153, 155]. The selected structures were minimized on a DFT level in
order to prepare them for the following defect calculations. During this step, a
small structural relaxation was observed indicating that no bonds had been
broken.


 -
- structures.
  ,
,  , and
, and  denote the first maximum
in the corresponding pair-correlation functions.
denote the first maximum
in the corresponding pair-correlation functions.  and
and  are
the maxima of the respective angle distributions. The obtained values compare
reasonably well with the published values in
are
the maxima of the respective angle distributions. The obtained values compare
reasonably well with the published values in  angles are quite sensitive to the details of
the used structure generation method. Thus, their values in the literature
angles are quite sensitive to the details of
the used structure generation method. Thus, their values in the literature  and
and
 and thus are still debated
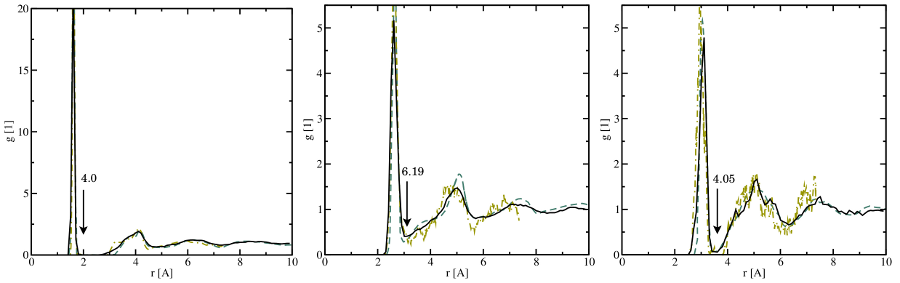
 (left), the
 (middle), and the
  (right) bonds. The solid black lines represent
the data obtained in this thesis while the dashed ochre and the dashed-dotted
green line are extracted from the studies of Sarnthein
(right) bonds. The solid black lines represent
the data obtained in this thesis while the dashed ochre and the dashed-dotted
green line are extracted from the studies of Sarnthein  DFT molecular dynamics run at
  for five different
samples. The first sharp peak corresponds to the length of the respective bond
type and compare well with the values from literature (see Table
for five different
samples. The first sharp peak corresponds to the length of the respective bond
type and compare well with the values from literature (see Table  ,
,  , and
, and
 have been obtained for the
  , the
, the  , and the
  bonds
in agreement with
bonds
in agreement with  . Furthermore, the first peaks overlap with the next features at the right
integration limit (indicated by the arrow) leading to an inaccurate determination
of the numbers of first nearest neighbors.
. Furthermore, the first peaks overlap with the next features at the right
integration limit (indicated by the arrow) leading to an inaccurate determination
of the numbers of first nearest neighbors.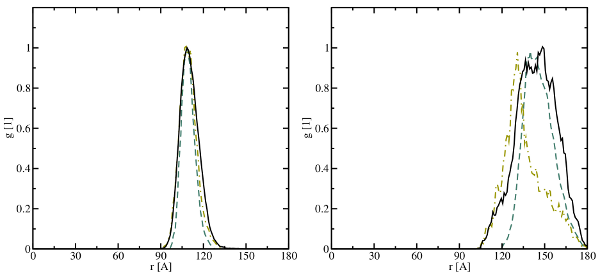
 -
- -
- (left) and the
  -
- -
- (right) chains for the data of this thesis and (ochre) Sarnthein
  -
- -
- angle distribution are in reasonable agreement with the
extracted data in
angle distribution are in reasonable agreement with the
extracted data in  -
- -
- angles are subject
to appreciable deviations, which originate from the complications mentioned
in Table
angles are subject
to appreciable deviations, which originate from the complications mentioned
in Table