2.3 The Level Shift
The Frank-Condon theory provides a theoretically profound description of
vibronic transitions and has a wide range of applications in quantum chemistry,
such as the calculation of the absorption and fluorescence spectra. In the
following, this theory will be employed for the case of charge trapping into
oxide defects and will lead to a shift of the defect levels. This level shift
can be best explained using a configuration coordinate diagram of a defect
(depicted in Fig. 2.3). The neutral defect is represented by the curve  ,
which can, for instance, be identified with the formation energy
,
which can, for instance, be identified with the formation energy  of the
defect.
In equilibrium, the neutral defect takes on its minimum configuration
of the
defect.
In equilibrium, the neutral defect takes on its minimum configuration  labeled
with A in Fig. 2.3. If the defect is charged positively, one electron has to be removed
from the defect and placed within the substrate valence band, for instance at
labeled
with A in Fig. 2.3. If the defect is charged positively, one electron has to be removed
from the defect and placed within the substrate valence band, for instance at  .
As a consequence, the electron energy
.
As a consequence, the electron energy  must be added to the defect energy
 for a correct comparison with
  . But one should consider that
vibronic transitions can occur with each conduction or valence band state
in the substrate, including the energies
. But one should consider that
vibronic transitions can occur with each conduction or valence band state
in the substrate, including the energies  and
and  . As mentioned
before, the transition rates for charge trapping can be calculated using the
Franck-Condon theory. The corresponding equation (2.21) depends most
strongly on the factor
. As mentioned
before, the transition rates for charge trapping can be calculated using the
Franck-Condon theory. The corresponding equation (2.21) depends most
strongly on the factor  , which is determined by the overlap of the nuclei
wavefunctions. This factor reaches the largest values for vibrational transitions,
whose energies lie close the intersection point (IP) of the adiabatic potentials. In the
classical limit, it is even peaked at the energy of this intersection point, at
which the vibronic transition is assumed to occur. During a hole capture
process, the neutral defect is initially in its equilibrium configuration
, which is determined by the overlap of the nuclei
wavefunctions. This factor reaches the largest values for vibrational transitions,
whose energies lie close the intersection point (IP) of the adiabatic potentials. In the
classical limit, it is even peaked at the energy of this intersection point, at
which the vibronic transition is assumed to occur. During a hole capture
process, the neutral defect is initially in its equilibrium configuration  (state
 in Fig. 2.3). There, the defect has an energy of
  , which only
intersects with
, which only
intersects with  when the emitted electron is placed at the energy
level
when the emitted electron is placed at the energy
level  in the substrate valence band. It is emphasized here that the
defect is assumed not to overcome the barrier over the intersection point
IP (path C
in the substrate valence band. It is emphasized here that the
defect is assumed not to overcome the barrier over the intersection point
IP (path C  IP
IP  A in Fig. 2.3) in the concept of the level shift.
During the tunneling transition of the electron, the defect is not capable of
adopting the new configuration of the new charge state according to the
Franck-Condon principle. Afterwards, it is in the state
A in Fig. 2.3) in the concept of the level shift.
During the tunneling transition of the electron, the defect is not capable of
adopting the new configuration of the new charge state according to the
Franck-Condon principle. Afterwards, it is in the state  and relaxes to the
equilibrium configuration
and relaxes to the
equilibrium configuration  (state
  ). During this process, the defect
dissipates the relaxation energy of
). During this process, the defect
dissipates the relaxation energy of  to the heat bath. In the
case of an electron capture process, the defect is initially in its equilibrium
configuration
to the heat bath. In the
case of an electron capture process, the defect is initially in its equilibrium
configuration  labeled with B in Fig. 2.3. A vibronic transition is only allowed,
if a substrate electron is excited to the energy
labeled with B in Fig. 2.3. A vibronic transition is only allowed,
if a substrate electron is excited to the energy  (from state A” to
B) by the heat bath. Then the defect plus the electron have an energy of
(from state A” to
B) by the heat bath. Then the defect plus the electron have an energy of
 (state
  in Fig. 2.3), which coincides with the energy of
the neutral defect
in Fig. 2.3), which coincides with the energy of
the neutral defect  . Analogously to the hole capture process, the
defect configuration
. Analogously to the hole capture process, the
defect configuration  is preserved during the tunneling transition (state
 ). Afterwards the defect undergoes a structural relaxation to state
  thereby dissipating an energy of
  to the heat bath. The
aforementioned electron levels
to the heat bath. The
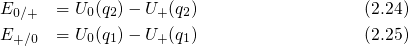
aforementioned electron levels  and
and  are usually referred to as switching
levels and can be defined as the difference of adiabatic potential energies:
are usually referred to as switching
levels and can be defined as the difference of adiabatic potential energies:
There is a the shift between energy levels for electron ( ) and hole
(
) and hole
( ) capture. This difference is ascribed to the fact that the defects have
different equilibrium configurations
) capture. This difference is ascribed to the fact that the defects have
different equilibrium configurations  and
and  for different charge states
of the defect. As a consequence, an ‘elastic’ vibronic transition can only
occur at different energies in the configuration coordinate diagram. This
requires that the exchanged electron has different energies
for different charge states
of the defect. As a consequence, an ‘elastic’ vibronic transition can only
occur at different energies in the configuration coordinate diagram. This
requires that the exchanged electron has different energies  and
and  for electron and hole capture — a fact that has motivated the term ‘level
shift’. It is important to note at this point that the above considerations
are not restricted to defect transitions between positive and neutral charge
states and can in principle be extended to all possible combinations of charge
states.
for electron and hole capture — a fact that has motivated the term ‘level
shift’. It is important to note at this point that the above considerations
are not restricted to defect transitions between positive and neutral charge
states and can in principle be extended to all possible combinations of charge
states.
In conclusion, the conventional concept of fixed trap levels must be questioned if a
defect has distinct equilibrium configurations for two charge states. Instead, the
trap/defect levels depend on their charge state, which can have a considerable impact
on the trapping dynamics. Although this concept has not been applied to charge
trapping so far, it can give an explanation for trap-assisted tunneling through
dielectrics [112, 113].
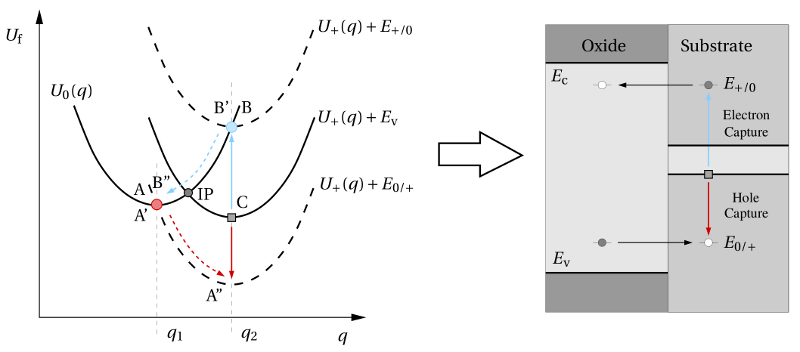
 and
and  represents the adiabatic
potentials of the positive and neutral defect system, respectively. In the former
case, the tunneling electron is moved to the substrate where it sits at the valence
band edge. When the electron has a different energy, for instance
represents the adiabatic
potentials of the positive and neutral defect system, respectively. In the former
case, the tunneling electron is moved to the substrate where it sits at the valence
band edge. When the electron has a different energy, for instance  or
or
 , the corresponding adiabatic potential is shifted on the energy scale
and depicted by the dashed lines. The red and the blue filled circle indicates
the points, where the hole and electron trapping process can occur. These
points only represent the temporary states, which are realized right after the
tunneling process. The band diagram on the right-hand side includes the defect
levels extracted from the configuration coordinate diagram (left). The resulting
electron (
, the corresponding adiabatic potential is shifted on the energy scale
and depicted by the dashed lines. The red and the blue filled circle indicates
the points, where the hole and electron trapping process can occur. These
points only represent the temporary states, which are realized right after the
tunneling process. The band diagram on the right-hand side includes the defect
levels extracted from the configuration coordinate diagram (left). The resulting
electron ( ) and hole capture (
 ) level can be separated by several
electron Volts, where only one of these two levels can be active at a time.
Interestingly, the energy level
) level can be separated by several
electron Volts, where only one of these two levels can be active at a time.
Interestingly, the energy level  must always lie above
  due to the
positive curvature of the adiabatic potentials.
due to the
positive curvature of the adiabatic potentials.