 and
and  in Fig. 7.3, as often only
a part of the S-shaped recovery characteristic can be recorded by the
experiment.
in Fig. 7.3, as often only
a part of the S-shaped recovery characteristic can be recorded by the
experiment.
The question arises whether this different recovery shapes are due to an artifact again (cf. Chapter 6.5) or not. Therefore, the key findings are presented first. Given that aid it is possible to discuss the experimental results afterwards.
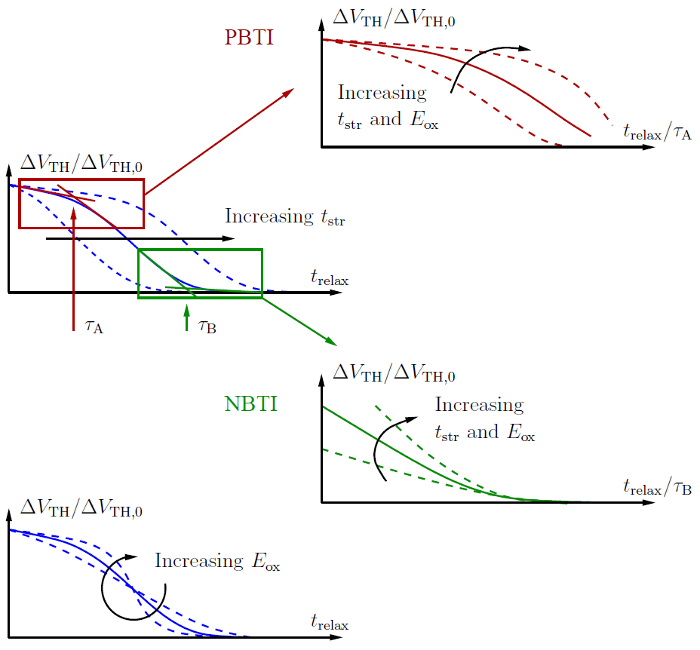
Let us assume a recovery trace that shows both features, early as well as
delayed recovery. Considering the assumptions that no recovery is missed in the
beginning and no additional negative charges are created at the same time till
the total charges are released again yields the complete recovery trace after BTI
stress, schematically depicted in the top left of Fig. 7.4. Unfortunately the full
features of the recovery after typical BTI stress are rarely visible, cf. the
curve of and in Fig. 7.3, as often only
a part of the S-shaped recovery characteristic can be recorded by the
experiment.
 and
and  . For longer
 the whole curve is shifted to higher
  . PBTI mainly shows the
characteristics in the top left (red) box, whereas the behavior after NBTI
stress typically proceeds as shown in the bottom right (green) box. Within
these sections
. PBTI mainly shows the
characteristics in the top left (red) box, whereas the behavior after NBTI
stress typically proceeds as shown in the bottom right (green) box. Within
these sections  and
and  depend on the curvatures and mark the
transition between the initial and the concluding phase of the recovery.
Bottom Left: In combination with the oxide electric field dependence, the
behavior of PBTI and NBTI can be obtained by scaling with
depend on the curvatures and mark the
transition between the initial and the concluding phase of the recovery.
Bottom Left: In combination with the oxide electric field dependence, the
behavior of PBTI and NBTI can be obtained by scaling with  and
and  .
Top Right: Increasing stress conditions (
.
Top Right: Increasing stress conditions ( and/or
  ) for PBTI yield
smaller relaxation rates per decade at earlier
) for PBTI yield
smaller relaxation rates per decade at earlier  , followed by larger
relaxation rates afterwards. When extending the observation period towards
larger
, followed by larger
relaxation rates afterwards. When extending the observation period towards
larger  , the transition back to smaller relaxation rates becomes
visible. Bottom Right: Increased stress conditions after NBTI feature
increased relaxation up to
, the transition back to smaller relaxation rates becomes
visible. Bottom Right: Increased stress conditions after NBTI feature
increased relaxation up to  . Extending the observation period towards
smaller
. Extending the observation period towards
smaller  after NBTI stress is often not possible due to the limited
measurement speed.
after NBTI stress is often not possible due to the limited
measurement speed.
While for PBTI only the upper section of the whole relaxation curve is visible, it is the lower section for NBTI. Within these sections the curvature marks the transition between the initial and the late phase of the recovery respectively. By using this curvature to detect a change of the relaxation the recovery following PBTI versus NBTI stress is now analyzed in more detail.