6.5 Relaxation Behavior
For relaxation, based on the assumption of full recovery after each stress/relaxation cycle,
 is chosen with
  being the pulse period, and implying
 . Therefore
  is independent of
  , whereas
  depends on the
  used. Note that due to record length constraints of
the DSO, not the entire relaxation characteristic up to
used. Note that due to record length constraints of
the DSO, not the entire relaxation characteristic up to  is recorded,
but only the initial relaxation up to around three to four times
is recorded,
but only the initial relaxation up to around three to four times  .
The point
.
The point  nevertheless is available in the pre-trigger data of the
DSO.
nevertheless is available in the pre-trigger data of the
DSO.
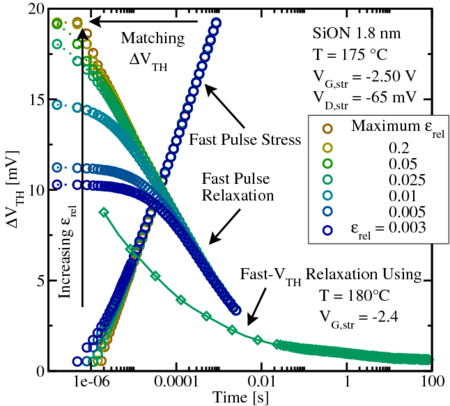
Data extraction turns out to be extremely sensitive to the choice of  ,
indicating that the settling time of
,
indicating that the settling time of  plays a crucial role in OTF experiments.
To demonstrate this fact, Fig. 6.18 shows relaxation after
plays a crucial role in OTF experiments.
To demonstrate this fact, Fig. 6.18 shows relaxation after  for
different values of
for
different values of  . If the criterion is too conservative, i.e.
  is chosen
small, thereby cutting off the initial relaxation phase, the shape of the
relaxation characteristics is significantly altered. On the other hand, too large
values of
is chosen
small, thereby cutting off the initial relaxation phase, the shape of the
relaxation characteristics is significantly altered. On the other hand, too large
values of  , i.e. too liberal limits for gate voltage settling, may produce
spurious relaxation transients. In other words, with different
, i.e. too liberal limits for gate voltage settling, may produce
spurious relaxation transients. In other words, with different  values
more or less points are considered for the relaxation curves leading to
different initial slopes. The ‘real’ initial data, as seen in Fig. 6.18, then
becomes artificially dispersed when too many data points are cut off (small
values
more or less points are considered for the relaxation curves leading to
different initial slopes. The ‘real’ initial data, as seen in Fig. 6.18, then
becomes artificially dispersed when too many data points are cut off (small
 ).
).
Assuming the relaxation follows  as indicated by the red curve in
Fig. 6.18, and setting the starting point of the extracted relaxation to later times
(through smaller
as indicated by the red curve in
Fig. 6.18, and setting the starting point of the extracted relaxation to later times
(through smaller  ) gives a dependence of
  , which produces
the artificial plateaus seen with the blue curves in the figure. This may lead to
the wrong conclusion that the time constants are smaller than they actually
are. Possibly the saturation towards smaller relaxation times found in
[42, 102, 107] could be explained that way, i.e. the plateaus observed are not a
feature of NBTI relaxation but an artifact due to finite settling times and
synchronization inaccuracies, in turn invalidating the assertion that a
measurement delay in the micro-second regime is sufficient to correctly capture
the relaxation characteristics of NBTI. Besides, though an
, which produces
the artificial plateaus seen with the blue curves in the figure. This may lead to
the wrong conclusion that the time constants are smaller than they actually
are. Possibly the saturation towards smaller relaxation times found in
[42, 102, 107] could be explained that way, i.e. the plateaus observed are not a
feature of NBTI relaxation but an artifact due to finite settling times and
synchronization inaccuracies, in turn invalidating the assertion that a
measurement delay in the micro-second regime is sufficient to correctly capture
the relaxation characteristics of NBTI. Besides, though an  of 0.025
seems to be quite large, the resulting
of 0.025
seems to be quite large, the resulting  only lies within
  of the
settled
of the
settled  . Therefore these values well account for the relaxation
region.
. Therefore these values well account for the relaxation
region.
 measurement and the fast
pulsed
measurement and the fast
pulsed  -method both developed by Reisinger
  , more or less points are considered for
the relaxation curves leading to different initial slopes. While
, more or less points are considered for
the relaxation curves leading to different initial slopes. While  results in an artificial plateau, as the data points are stretched out towards
shorter times,
results in an artificial plateau, as the data points are stretched out towards
shorter times,  shows good agreement with the data obtained
from the fast-
shows good agreement with the data obtained
from the fast- measurement, which do not have a plateau.