Next: 5.1.5 Model Calibration Up: 5.1 Calibration of Trenches Previous: 5.1.3 TEOS Deposition Contents
|
|
In this section, the most promising models are described together with the best parameter sets which lead to the most accurate simulation results for the TEOS deposition in a certain AR range. The simulations have been performed using the topography simulator ELSA (Enhanced Level Set Applications) which follows the surface evolution by solving the level set equation [319,333]. The parameter calibration and the optimizations have been carried out using the simulation and optimization framework SIESTA (cf. [334] and Section 4.5).
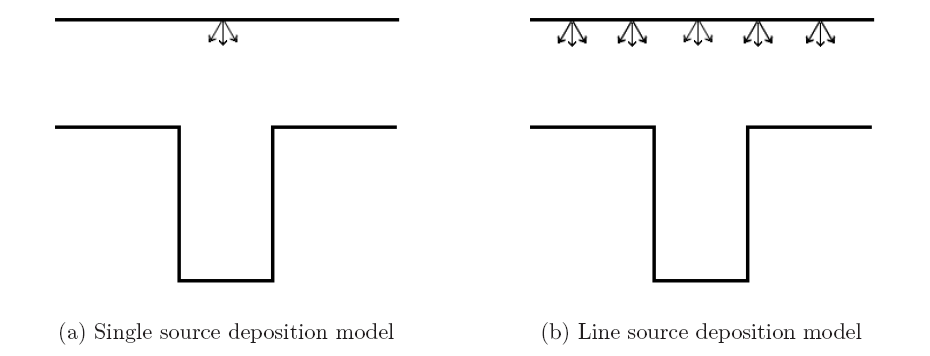
In an early attempt a model based on a single point-shaped material source was
considered [333]. SIESTA was used to identify the
sticking coefficients of the model and to tune the model, the distance between
the source and the upper trench surface.
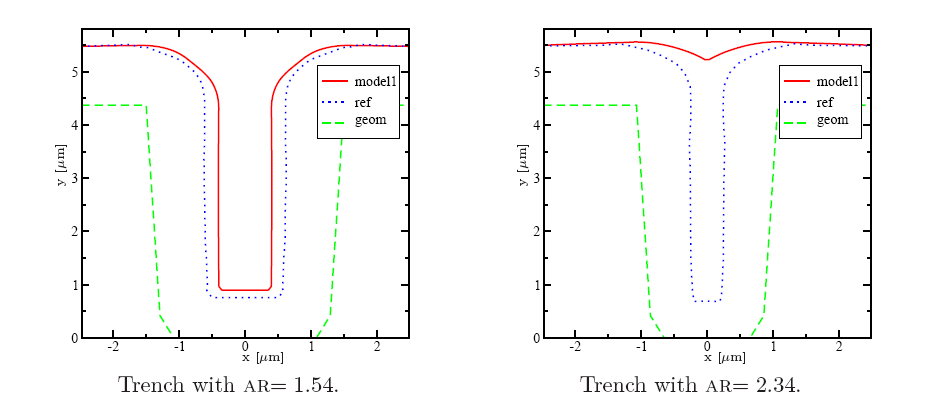
The optimization has been performed for a trench with
![]() .
In Figure 5.3a a calibration result for this particular trench is
presented.
However, if this model is applied to trenches with a higher AR, the simulation
results become worse and do neither quantitatively nor qualitatively compare
with the measurement for an increased AR above approximately
.
In Figure 5.3a a calibration result for this particular trench is
presented.
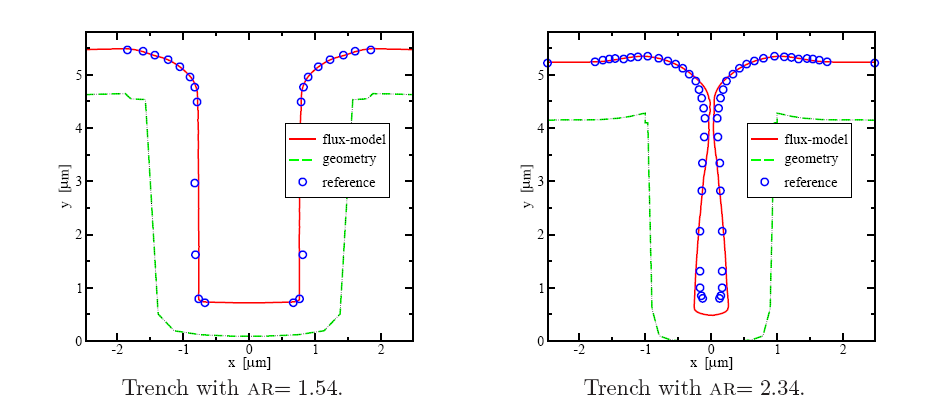
However, if this model is applied to trenches with a higher AR, the simulation
results become worse and do neither quantitatively nor qualitatively compare
with the measurement for an increased AR above approximately ![]() as is
presented in Figure 5.3b for trenches with AR of 1.54 and 2.34.
Here, the latter trench is completely closed in contrast to the measurements.
Nevertheless, for planar surfaces as well as for trenches with very low aspect
ratios, this model gives reasonable good results.
as is
presented in Figure 5.3b for trenches with AR of 1.54 and 2.34.
Here, the latter trench is completely closed in contrast to the measurements.
Nevertheless, for planar surfaces as well as for trenches with very low aspect
ratios, this model gives reasonable good results.
Since the previous approach delivers only satisfactory results for a very
limited set of trenches, the single source model has been expanded to a
continuous line-source model where the material flux depends only on the visible
angle between the surface elements and the source.
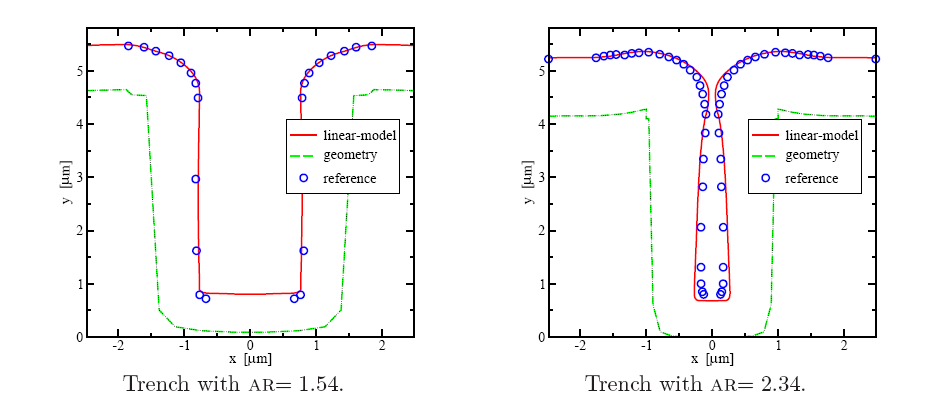
The model describes the
![]() deposition by two sticking coefficients,
where the first sticking coefficient
deposition by two sticking coefficients,
where the first sticking coefficient ![]() describes the sticking
probability of the incoming TEOS particles.
As already mentioned, when the TEOS molecule hits the hot wafer surface, the
TEOS molecule is pyrolytically dissociated.
The probability that the
describes the sticking
probability of the incoming TEOS particles.
As already mentioned, when the TEOS molecule hits the hot wafer surface, the
TEOS molecule is pyrolytically dissociated.
The probability that the
![]() will stick at the surface is modeled with
the constant sticking coefficient
will stick at the surface is modeled with
the constant sticking coefficient ![]() . With a certain probability
(
. With a certain probability
(![]() ), the particle is reflected from the first contact and hits the
surface a second time. The probability that the
), the particle is reflected from the first contact and hits the
surface a second time. The probability that the
![]() is deposited at the
second surface hit is described with the second sticking coefficient
is deposited at the
second surface hit is described with the second sticking coefficient ![]() .
.
|
 |
(5.4) |
|
With increasing AR the overestimation of the thickness at the bottom increases as
shown in Figure 5.4b and Figure 5.5b.
Thus, another deposition model has been developed which considers two
statistically independent species taking part in the TEOS deposition reaction.
The first species is the original TEOS which is dissociated at
the wafer surface.
The second species is a sum of all other by-products of this pyrolytic
reaction for which an average sticking probability is assigned.
Since this model considers as initial condition a uniform distribution of
reactants in the reactor, the sticking probability for both types of species can
be assumed to be statistically independent.
However, there is a dependence that the mass flux of the chemical by-products
has to be proportional to the incoming material flux of TEOS due to mass
conservation.
With the assumption that the TEOS deposition is a LPCVD process, the
TEOS particles are in a rather low concentration in the reactor and have a
large mean free path between collisions. Thus, the material source for the reactor has
to be sufficiently provide TEOS inside the reactor to obtain a
stable deposition process.
Since this requires a high exchange rate of the gases inside the reactor
according to balance the high consumption rate of TEOS, the ratio between the
TEOS concentration and the concentration of the by-products can be assumed to
be in average constant.
Despite of this fact the second species is modeled with an additional
constraint which guarantees that the flux of the second species is proportional
to the reflections of the first species because the second species is a product
from the dissociation of the TEOS particles.
If, for instance, trenches with higher ARs are considered, the material
deposition at the bottom of the trench is much less than at the top because the
distance form the TEOS source to the bottom of the
trench is much wider and the by-products cannot be exhausted as quickly as from
the top side of the trench.
Hence, the flux of the second species is modeled to be proportional to the flux
of the first species but with a statistically independent sticking probability.
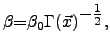
This new two-species model shows excellent agreement with measurements for
different geometries as shown in Figure 5.6a and Figure 5.6b.
The sticking coefficient ![]() and
and ![]() were identified with SIESTA
as
were identified with SIESTA
as
![]() and
and
![]() .
In addition to the astonishing agreement, this model provides faster simulation
results and requires only
.
In addition to the astonishing agreement, this model provides faster simulation
results and requires only ![]() of the CPU time compared to the
flux-dependent deposition model and overcomes the overestimation at the side
walls of the trenches.
Thus, the presented method enables efficient and accurate geometry
optimizations.
The hereby extracted sticking coefficients have also been applied to
three-dimensional structures and have shown promising results.
of the CPU time compared to the
flux-dependent deposition model and overcomes the overestimation at the side
walls of the trenches.
Thus, the presented method enables efficient and accurate geometry
optimizations.
The hereby extracted sticking coefficients have also been applied to
three-dimensional structures and have shown promising results.
| |