Next: 5.2 Parameter Extraction of Up: 5.1 Calibration of Trenches Previous: 5.1.4 Deposition Models Contents
During the model calibrations and the identification of the new model parameters, the inverse modeling mode of SIESTA has been used. The calibration of this fairly complex TEOS process required a large numerical effort in terms of the number of parameter evaluations which was therefore performed on a heterogeneous network with more than 50 computational nodes. This was possible because the parameter sets were independent from each other.
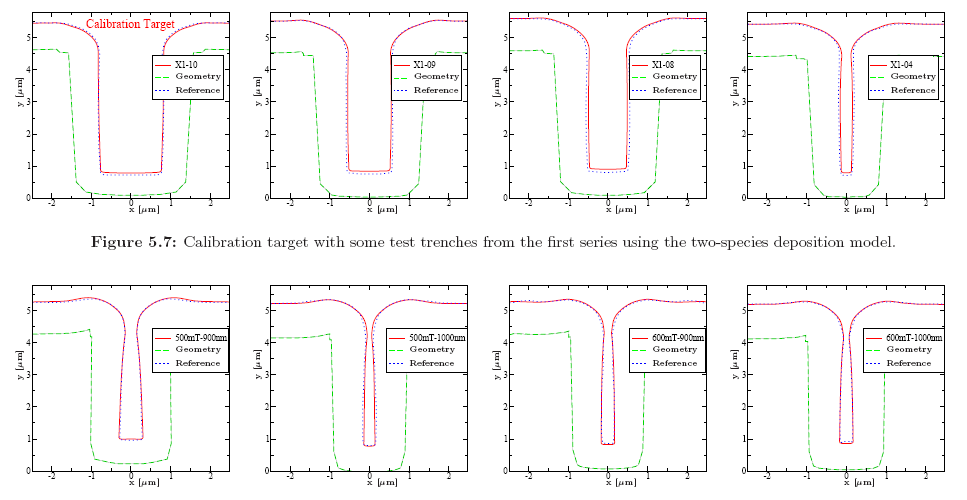
To verify the different models, each model has to be calibrated for certain characteristic trenches in order to check whether the model fulfills the requirements. This procedure is very time consuming. Hence a critical trench (cf. Figure 5.1b) has been selected for performing all tests trench to compare the different models under the same conditions. This calibration target has been chosen as a reference because the aspect ratio is rather small, the shape of the surface is unusual and shows a certain non-conformity of the thickness of the deposited material, and the rounding at the trench openings are asymmetric. Figure 5.7 presents the result of the calibration of the two-species model in comparison to other trenches with a different aspect ratio. The parameters obtained from this calibration have been applied to completely different trenches created with the same process technology (cf. Figure 5.8). As can be seen, the model with the calibrated parameters also gives excellent agreement for different trenches.
 |
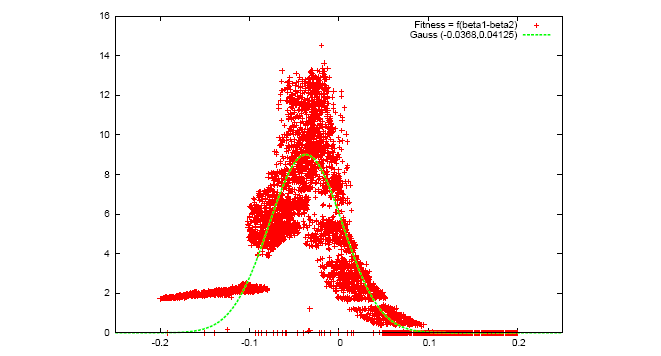
In order to demonstrate the computational effort, Figure 5.9 depicts the fitness value of the best 6000 parameter sets of the calibration for the two-species model.
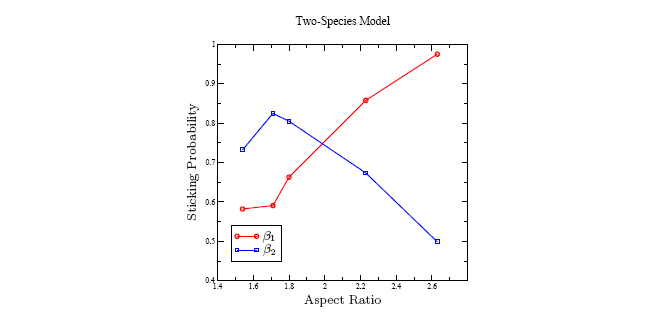
The simulation results shown in Figure 5.7 and Figure 5.8 are obtained by applying the extracted sticking coefficients from the calibration of the target trench. However, the best results can be obtained if a calibration is performed for each single trench. The results for some selected test trenches from the first series (cf. Figure 5.7) are shown in Figure 5.10. The tendency shows that with increasing aspect ratios, the sticking probability drops rapidly. Due to the depletion of the active reactants in the trenches an exponential behavior is reported [335].