The ballistic phonon transmission function and thus the ballistic thermal conductance in the Landauer formalism are determined by the
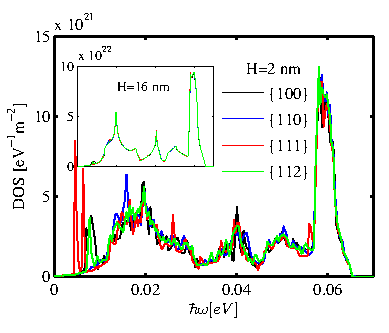
product of the density of states and the group velocity (Eq. 2.42). In Fig. 4.11 we plot the density of states for thin-layers of thickness
![]() with four different surface orientations. Although some differences are observed for the different surface orientations, especially in the low frequency range, the overall values and trends are very similar. The inset of Fig. 4.11 shows the density of states for layers of thickness
with four different surface orientations. Although some differences are observed for the different surface orientations, especially in the low frequency range, the overall values and trends are very similar. The inset of Fig. 4.11 shows the density of states for layers of thickness
![]() . In this case a much smaller variation is observed as expected, since the phonon density of states depends on the number of atoms, and layers of the same thickness contain a similar amount of atoms. At smaller thicknesses the different arrangement of atoms can result in slightly different numbers of atoms for different surfaces, but as the thickness increases the crystal becomes more uniform and any variations are eliminated. In general, of course, the arrangement of atoms, the coupling between them, and the type of interactions they have can also influence their density of states. But as we show in Fig. 4.11, such effects on the density of states are only important at very thin sizes, i.e.
. In this case a much smaller variation is observed as expected, since the phonon density of states depends on the number of atoms, and layers of the same thickness contain a similar amount of atoms. At smaller thicknesses the different arrangement of atoms can result in slightly different numbers of atoms for different surfaces, but as the thickness increases the crystal becomes more uniform and any variations are eliminated. In general, of course, the arrangement of atoms, the coupling between them, and the type of interactions they have can also influence their density of states. But as we show in Fig. 4.11, such effects on the density of states are only important at very thin sizes, i.e.
![]() , and even then, they are small. From this one can conclude that the variation in the thermal conductance and transmission does not originate from the difference in the density of states.
, and even then, they are small. From this one can conclude that the variation in the thermal conductance and transmission does not originate from the difference in the density of states.
|
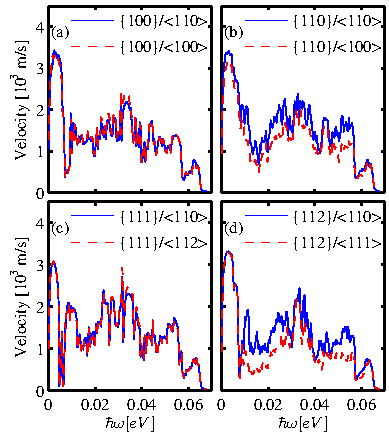
In Fig. 4.12 the effective group velocity defined in Eq. 4.1 is plotted. This quantity is orientation-dependent, in contrast to the density of states, and indicates how dispersive the modes are. The velocity
![]() is calculated along the transport direction. The density of states times the effective group velocity is proportional to the transmission function. Therefore, the differences in the transmission functions should be seen in the effective group velocities of the channels, since the density of states is the same for all channels of the same thickness. Figure 4.12 shows the effective group velocities of the channels considered. Figures 4.12-a and 4.12-c show the effective group velocities of thin-layers with
is calculated along the transport direction. The density of states times the effective group velocity is proportional to the transmission function. Therefore, the differences in the transmission functions should be seen in the effective group velocities of the channels, since the density of states is the same for all channels of the same thickness. Figure 4.12 shows the effective group velocities of the channels considered. Figures 4.12-a and 4.12-c show the effective group velocities of thin-layers with ![]() and
and ![]() surfaces along the two different orientations with the lowest and highest thermal conductance for each surface orientation. The two different cases for each surface are almost identical, as in the case of the transmission functions in Fig. 4.8-a and 4.8-c. Figures 4.12-b and 4.12-d show the effective group
velocities for channels with
surfaces along the two different orientations with the lowest and highest thermal conductance for each surface orientation. The two different cases for each surface are almost identical, as in the case of the transmission functions in Fig. 4.8-a and 4.8-c. Figures 4.12-b and 4.12-d show the effective group
velocities for channels with ![]() and
and ![]() surface orientations, respectively. A variation is
observed for the different channels, which causes the difference in the transmission
functions shown earlier in Fig. 4.8-b and 4.8-d.
surface orientations, respectively. A variation is
observed for the different channels, which causes the difference in the transmission
functions shown earlier in Fig. 4.8-b and 4.8-d.
|
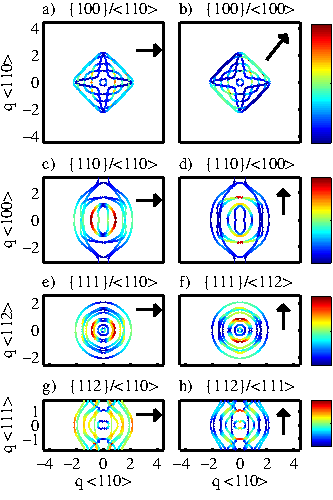
The anisotropy of the effective group velocity originates from the phonon bandstructure. In Fig. 4.13 the contour plots of the phonon bandstructure at
![]() is shown for the eight channels considered in Fig. 4.8 and Fig. 4.12 for layer thickness
is shown for the eight channels considered in Fig. 4.8 and Fig. 4.12 for layer thickness
![]() . This is an energy value at which the most significant differences for the channels with
. This is an energy value at which the most significant differences for the channels with ![]() and
and ![]() surfaces appear. It turns out that what is presented for this energy is a good indicator of the anisotropic behavior of the entire energy spectrum, most of which contributes to thermal conductance at room temperature. The lines represent the different modes at that energy, whereas the colormap indicates the cumulative ballistic thermal conductance at room temperature in the transport orientation of the specific channel of interest, as indicated by the arrow in each case. Elongation of contour lines along a specific direction provides high phonon group velocities in the perpendicular direction, and consequently high thermal conductance. This is very similar to the low effective mass and high velocities of carriers in an ellipsoidal band along the direction of the short axis.
surfaces appear. It turns out that what is presented for this energy is a good indicator of the anisotropic behavior of the entire energy spectrum, most of which contributes to thermal conductance at room temperature. The lines represent the different modes at that energy, whereas the colormap indicates the cumulative ballistic thermal conductance at room temperature in the transport orientation of the specific channel of interest, as indicated by the arrow in each case. Elongation of contour lines along a specific direction provides high phonon group velocities in the perpendicular direction, and consequently high thermal conductance. This is very similar to the low effective mass and high velocities of carriers in an ellipsoidal band along the direction of the short axis.
|
Figures 4.13-a and 4.13-b show the energy contours for the ![]() surface in the
surface in the
![]() and
and
![]() transport orientations, respectively (indicated by the arrow). Despite the square like shape of the contour, which indicates that there is different symmetry in the two orientations of interest, the contours are elongated
similarly in both directions, which results in a similar thermal conductance for both channels. This is the case for almost the entire energy spectrum (although at higher energies there are many more modes and more complex contour shapes). In the case of the
transport orientations, respectively (indicated by the arrow). Despite the square like shape of the contour, which indicates that there is different symmetry in the two orientations of interest, the contours are elongated
similarly in both directions, which results in a similar thermal conductance for both channels. This is the case for almost the entire energy spectrum (although at higher energies there are many more modes and more complex contour shapes). In the case of the ![]() surface in Fig. 4.13-e and 4.13-f, a highly symmetric contour provides very similar transmission functions and thermal conductances along the
surface in Fig. 4.13-e and 4.13-f, a highly symmetric contour provides very similar transmission functions and thermal conductances along the
![]() and
and
![]() directions.
directions.
The largest differences in the thermal conductance are observed for thin layers with ![]() and
and ![]() surfaces in Fig. 4.13-c, 4.13-d and Fig. 4.13-g, 4.13-h, respectively. In both cases, the contours at energy
surfaces in Fig. 4.13-c, 4.13-d and Fig. 4.13-g, 4.13-h, respectively. In both cases, the contours at energy
![]() are clearly elongated along the vertical axis. This results in a larger phonon group velocity along the horizontal axis, and finally a higher thermal conductance, as also indicated by the colormap. This is especially evident for the
are clearly elongated along the vertical axis. This results in a larger phonon group velocity along the horizontal axis, and finally a higher thermal conductance, as also indicated by the colormap. This is especially evident for the ![]() surface, where the contour of the
surface, where the contour of the
![]() channel in Fig. 4.13-g is colored much closer to red (higher conductance value) than the
channel in Fig. 4.13-g is colored much closer to red (higher conductance value) than the
![]() channel in Fig. 4.13-h, indicating much larger phonon group velocities. This causes the thermal transmission and conductance of the
channel in Fig. 4.13-h, indicating much larger phonon group velocities. This causes the thermal transmission and conductance of the
![]() channel to be higher than that of the
channel to be higher than that of the
![]() channel shown in Fig. 4.8-d and Fig. 4.9-d.
channel shown in Fig. 4.8-d and Fig. 4.9-d.
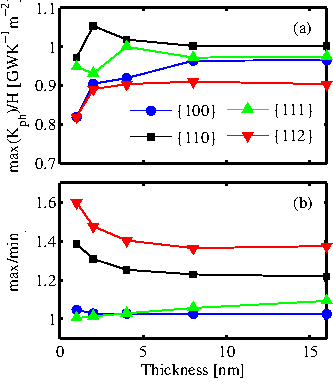
Figure 4.13 explains the origin of anisotropy in the ballistic thermal conductance of thin-layers with 2nm thickness. However, such effects also hold for all the thicknesses examined, i.e. up to
![]() . The anisotropic behavior depends
weakly on the layer thickness. The ballistic conductance increases linearly as the layer
thickness increases due to the increased number of atoms which results in a larger number of phonon modes, but the anisotropy does not change significantly. This is illustrated in Fig. 4.14-a which shows the ballistic thermal conductance for each of the four surface orientations examined, normalized by the thickness of the layer. For each surface only the direction showing the maximum conductance is considered. The results show that in all cases the normalized conductance is constant, even down to a thickness of
. The anisotropic behavior depends
weakly on the layer thickness. The ballistic conductance increases linearly as the layer
thickness increases due to the increased number of atoms which results in a larger number of phonon modes, but the anisotropy does not change significantly. This is illustrated in Fig. 4.14-a which shows the ballistic thermal conductance for each of the four surface orientations examined, normalized by the thickness of the layer. For each surface only the direction showing the maximum conductance is considered. The results show that in all cases the normalized conductance is constant, even down to a thickness of
![]() . Below
. Below
![]() , variations of the order of
, variations of the order of ![]() are observed for all channels. From this, it follows that other than the reduction in the size of the phonon spectrum with thickness scaling, no significant changes in the shape of the phonon structure are observed, at least not significant enough to introduce changes in the thermal conductance. This is also supported by Fig. 4.14-b, which depicts the ratio of the maximum to the minimum thermal conductance that can be achieved for each surface. Similarly to Fig. 4.14-a, the anisotropy does not change with layer thickness even down to
are observed for all channels. From this, it follows that other than the reduction in the size of the phonon spectrum with thickness scaling, no significant changes in the shape of the phonon structure are observed, at least not significant enough to introduce changes in the thermal conductance. This is also supported by Fig. 4.14-b, which depicts the ratio of the maximum to the minimum thermal conductance that can be achieved for each surface. Similarly to Fig. 4.14-a, the anisotropy does not change with layer thickness even down to
![]() . Again, below
. Again, below
![]() , differences of the order of
, differences of the order of ![]() can be observed.
can be observed.
|
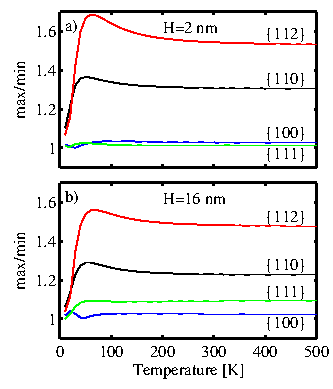
This anisotropy observed is not only a function of thickness, but also of temperature. Figure 4.15 shows the ratio of the maximum to the minimum ballistic thermal conductance for the four surface orientations of interest, again by choosing the appropriate transport orientations. Figure 4.15-a and 4.15-b show results for
![]() and
and
![]() , respectively. The maximum anisotropy (up to
, respectively. The maximum anisotropy (up to ![]() ) is observed for the
) is observed for the ![]() surface, followed by the
surface, followed by the ![]() surface (up to
surface (up to ![]() ), whereas the thermal conductance for the
), whereas the thermal conductance for the ![]() and
and ![]() surfaces are more or less isotropic (the ratio stays
surfaces are more or less isotropic (the ratio stays ![]() ). This holds for most of the temperature range examined, even down to
). This holds for most of the temperature range examined, even down to
![]() . Below
. Below
![]() , the ratio approaches unity in all cases, because at this temperature the main contribution to thermal conductance comes from the acoustic branches at low energy, which are more isotropic. This is clearly observed in the low energy range of the transmissions in Fig. 4.8, in which the thermal conductivity is isotropic.
, the ratio approaches unity in all cases, because at this temperature the main contribution to thermal conductance comes from the acoustic branches at low energy, which are more isotropic. This is clearly observed in the low energy range of the transmissions in Fig. 4.8, in which the thermal conductivity is isotropic.
|