 m, and the oxide thickness
(
 ) is
) is 
 . The polysilicon gate doping concentration
(
 ) is equal to
  cm
cm as determined from
gate capacitance measurement with the device biased in the
inversion region.


Using the experimental input values and two-dimensional doping profiles and
the calibrated mobility model parameters, MINIMOS simulation
accurately reproduce experimental I-V and C-V characteristics
over a wide range of biases and devices. In this section, the width of all the
simulated and measured devices is 
 m, and the oxide thickness
(
 ) is
) is 
 . The polysilicon gate doping concentration
(
 ) is equal to
  cm
cm as determined from
gate capacitance measurement with the device biased in the
inversion region.
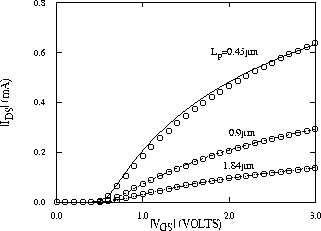
Fig. 5.2 shows measured and simulated results for the linear
region currents for three gate lengths.
Reasonable good agreement is found in all regions of bias for all three
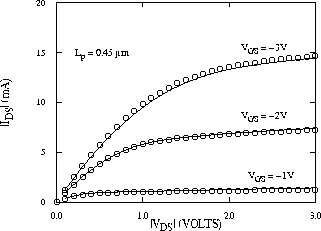
lengths. Fig. 6 shows a comparison of measured and simulated results
for the device with  = 0.45
  m. Note that a good agreement was
also obtained for longer devices (not shown).
It is expected that by using accurate inputs and properly calibrated
mobility model parameters, two-dimensional device simulation should also be
capable of achieving good agreement of intrinsic gate capacitances between
measurements and simulations without any further adjustments [56].
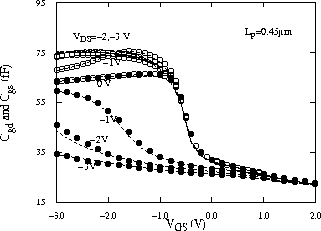
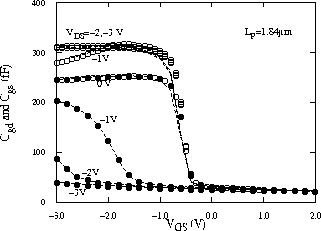
Indeed this is the case as shown in Fig. 5.4 and Fig. 5.5
which compare gate-to-source ( ) and gate-to-drain (
 )
capacitances for two-lengths of P-channel MOSFETs. Excellent agreement is
obtained for both bias-dependent intrinsic and overlap capacitances in all
regions of device operation (the accumulation, linear and saturation regions).

Figure 5.2:
Comparison of measured (symbols) and simulated (lines)
I-V characteristics in the linear region ( mV)
for three gate lengths (
 = 0.45, 0.9 and 1.84
  m).
m).

Figure 5.3: Comparison of measured (symbols) and simulated (lines)
I-V results in the linear and saturation regions for devices with
 .
.

Figure 5.4: Comparison of measured (symbols)  (lower 3 curves)
and
  (upper 3 curves) capacitances with simulated results
(lines) as a function of
  and
and  for device with

 m.
m.

Figure 5.5: Comparison of measured (symbols)  (lower 3 curves)
and
  (upper 3 curves) capacitances with simulated results
(lines) as a function of
  and
and  for device with

 m.
m.


