Next: 7.1.2 Post-Exposure Bake
Up: 7.1 Bake Steps
Previous: 7.1 Bake Steps
The purpose of a positive resist prebake is to dry the resist after spin coating
by removing solvent from the film. However, when heated to temperatures
above 70oC the PAC concentration M0 before
exposure begins to decompose to a light insensitive product X.
The initial reaction mechanism is thereby identical to
that of the PAC reaction during UV exposure [78,204]
but the dissolution (5.11) is now thermally driven,
 |
(7.1) |
Simple kinetic theory yieldsa
 |
(7.2) |
whereby
tpre denotes the bake time and
kpre(T) is the dissolution rate constant.
The dependence of the prebake reaction on the temperature T is modeled by the
rate constant
kpre(T).
For typical prebake conditions an Arrhenius law can be prescribed, i.e.,
 |
(7.3) |
Here
Kpre is the constant Arrhenius coefficient,
Epre the activation energy,
and R the universal gas constant.b From (7.2) follows that the
normalized PAC concentration after the bake takes the form
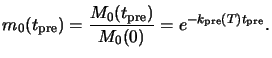 |
(7.4) |
The effect of the decomposition (7.2) is a change in the
chemical makeup of the resist. Consequently, any parameter depending
upon the quantitative composition of the resist also depends upon prebake.
The most important ones fall into three categories: (i) optical exposure
parameters such as the resist absorption coefficient; (ii) diffusion parameters
during post-exposure bake; and (iii) development parameters such as the
development rates of unexposed and completely exposed resist.
Following [108] we will now briefly describe a measurement technique
for the Arrhenius coefficient
Kpre and the activation
energy
Epre.
Dill's classical `ABC'-exposure model does not explicitly take into account
the effects of prebake on the resist composition
(cf. Section 5.1.2). For that the non-bleachable absorption
coefficient B of the resist given in (5.10) has to be
modified to include the absorption by the bake products X like
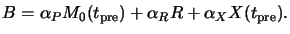 |
(7.5) |
Here  is the molar absorption coefficient of the decomposition
product X. The stoichiometry of (7.1) gives
X(tpre) = M0(tpre) - M0(0) so that
is the molar absorption coefficient of the decomposition
product X. The stoichiometry of (7.1) gives
X(tpre) = M0(tpre) - M0(0) so that
 |
(7.6) |
Considering now the two extreme cases of no bake (NB) at all and
full bake (FB) corresponding to the situation when all PAC is decomposed,
we get (cf. (5.10) and (7.5))
These two special cases show how the Dill A and B parameters vary with the
normalized PAC decomposition
m0(tpre)
of (7.4):
 |
(7.7) |
The bleachable absorption coefficient A decreases proportional to
the PAC concentration
m0(tpre) after the prebake,
whereas the non-bleachable coefficient B only slightly depends on
m0(tpre). It decreases if
 >
>  and decreases otherwise (cf. (7.7)
and (7.8)).
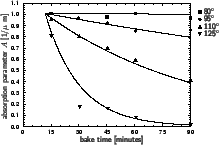
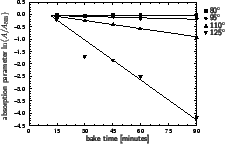
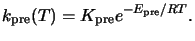
In Figure 7.1 the dependence of the resist absorption parameter
A on prebake time
tpre for a specific resist is shown.
The plots exhibits a time lag before the decomposition occurs. The reason
is a warm-up time of the wafer. In the given example approximately 12 minutes
are required to bring the wafer on the elevated temperature. From these
data the Arrhenius coefficient
Kpre
and decreases otherwise (cf. (7.7)
and (7.8)).
In Figure 7.1 the dependence of the resist absorption parameter
A on prebake time
tpre for a specific resist is shown.
The plots exhibits a time lag before the decomposition occurs. The reason
is a warm-up time of the wafer. In the given example approximately 12 minutes
are required to bring the wafer on the elevated temperature. From these
data the Arrhenius coefficient
Kpre  1.65 1020 1/minutes
and the activation energy
Epre
1.65 1020 1/minutes
and the activation energy
Epre  163.59 kJ/mol can be extracted.
Figure 7.1:
Dependence of the Dill absorption parameter A on
prebake time
tpre for the
KODAK 820 resist at a wavelength of 365 nm (after [205]).
|
|
Footnotes
- ... yieldsa
- Here we assume that the PAC concentration
M0 is homogeneous.
- ... constant.b
- The universal gas constant
equals R = kNA with the Boltzmann constant
k
 1.38 10-23 J/K and
the Avogadro number
NA
1.38 10-23 J/K and
the Avogadro number
NA  6.02 1023 1/mol. R has a value of
R
6.02 1023 1/mol. R has a value of
R  8.31 J/K mol.
Next: 7.1.2 Post-Exposure Bake
Up: 7.1 Bake Steps
Previous: 7.1 Bake Steps
Heinrich Kirchauer, Institute for Microelectronics, TU Vienna
1998-04-17