


Next: 5.1.3 Modeling of Chemically
Up: 5.1 Exposure Kinetics
Previous: 5.1.1 Absorption in a
5.1.2 Modeling of Conventional Resists
Following the Dill model [74] a typical conventional positive DQN
resist
consists of four major components, namely a base resin and solvent that both
determine the structural properties, a photoactive compound (PAC) that
is the light sensitive moiety,
and exposure products generated by the reaction of the PAC with the
exposing light. For more information about the decomposition of DQN resists
see Section 2.6.2. Disregarding any chemical details the
absorption coefficient of the photoresist can be written with
(5.5) as
 |
(5.6) |
Here we have used the following notation: M stands for the PAC, P for the
exposure products, R for the resin, and S for the solvents.
Because of the stoichiometry of the exposure reaction, the exposure products
P(x;t) are related to the PAC
M(x;t) by
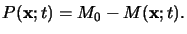 |
(5.7) |
Here M0 denotes the initial PAC concentration.
Using this relation the inhomogeneous terms in (5.6) can be
separated and the absorption coefficient
 (x;t) of the
photoresist follows to
(x;t) of the
photoresist follows to
 |
(5.8) |
whereby the lower case letter
m(x;t) refers to the absolute PAC
concentration
M(x;t) normalized by its initial concentration M0,
i.e.,
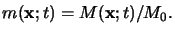 |
(5.9) |
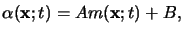
Hence the two constant parameters A and B are easily determined by
comparison of (5.8) with (5.6) yielding
 |
(5.10) |
The two quantities A and B make up the first two Dill photoresist parameters
and are also called the bleachable and non-bleachable absorption
coefficient of the photoresist, respectively.
This terminology stems from the fact that the
relation (5.8) describes the bleaching of the resist.
Bleaching implies the decrease of the absorbance
 (x;t) during
exposure as the PAC decomposes and thus
m(x;t) decreases. This
phenomenon is of great importance because the resist becomes more transparent
and therefore also deeper regions are exposed with sufficiently high light
intensity.
(x;t) during
exposure as the PAC decomposes and thus
m(x;t) decreases. This
phenomenon is of great importance because the resist becomes more transparent
and therefore also deeper regions are exposed with sufficiently high light
intensity.
What is missing now is the chemical modeling of the absorption process on an
atomic level. For that the absorption process can be thought of as
photons being absorbed by an atom or molecule causing an outer electron
to be promoted to a higher energy state. The light energy thereby absorbed
first weakens and finally breaks atomic bonds and thus
stimulates the chemical conversion of the PAC
M(x;t) into its
exposure products
P(x;t). Neglecting
the intermediate excited state of the molecules and only considering the direct
transition from the PAC to the products, i.e.,
 |
(5.11) |
the rate equation for this basic reaction can be derived with the help of simple
kinetic theory like the mass action law and writes to
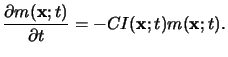 |
(5.12) |
Here C is the third Dill parameter of the resist describing the standard
exposure rate, and
I(x;t) is the absorbed light intensity.
The relation simply postulates that the dissolution rate of the PAC is
proportional to the absorbed light intensity and the
momentarily available amount of the PAC.
Most important, it shows the fundamental
operation principle of the photoresist. As the absorbed light intensity
I(x;t) depends on the aerial image Ii(x, y) that in its turn
carries the mask pattern, the image of the mask is stored in a latent image
m(x;texp) within the resist determining
the chemical state after an exposure of duration
texp.
The two relations (5.8) and (5.12) constitute
the so-called Dill's `ABC'-model. The three
parameters A, B, and C involved can be obtained by
graphical analysis of measured data [74] or
by fitting numerical simulation results to an entirely experimental
curve [136,137,138]. Values can be found in
the literature; however, every new resist has to be analyzed separately and the
extracted values are kept strictly confidential by any IC manufacturer.
Next: 5.1.3 Modeling of Chemically
Up: 5.1 Exposure Kinetics
Previous: 5.1.1 Absorption in a
Heinrich Kirchauer, Institute for Microelectronics, TU Vienna
1998-04-17