A.2 Variation of the enclosure height and the trace height above the ground plane,
comparisons of the transfer impedance for parallel planes with four open edges and
comparison of the transfer impedance for the two different trace routings in
Figure 5.7
The previous validation comparisons for the coupling factor  have been carried out
for an enclosure height of 7mm. This section contains comparisons for the enclosure with
the heights 10mm and 15mm, respectively.
have been carried out
for an enclosure height of 7mm. This section contains comparisons for the enclosure with
the heights 10mm and 15mm, respectively.
Additional comparisons are presented for trace heights above the ground plane of 1.5mm
and 3mm.
The good agreement of all comparisons validate the trace introduction coupling factor
for an enclosure, consisting of parallel rectangular planes with three closed and
one open edges, depicted in Figure 7.1.
The calculation of the coupling from PCB sources to the cavity field inside a slim
enclosure for emission simulation purposes is the intended application of this
dissertation. However, the trace introduction method can also be utilized to calculate
the coupling of traces to the parallel plane field of power planes. Parallel planes with
four open edges may represent the ground and the power plane on a PCB and a trace between
these two planes couples to the power delivery network. Therefore, additional comparisons
are presented in this appendix for rectangular parallel planes with four open edges, to
prove that the coupling factor is independent of the cavity boundaries. These comparisons
also show a very good agreement.
In Section 5.4 a transfer impedance comparison was
carried out for different routings of the horizontal routings of two traces with the same
trace lengths and same source and load positions on the ground plane. The model
configurations are depicted in Figure 5.7. The comparison for the
slot measurement port at position (64mm, 104mm) is presented in
Figure 5.8 and Figure 5.9. Transfer
impedance comparisons for the two other slot measurement ports at (10mm, 104mm) and
(124mm, 104mm) are presented in this appendix. The good agreement in these comparisons
validates the independence of the trace to cavity coupling from the horizontal trace
routing.

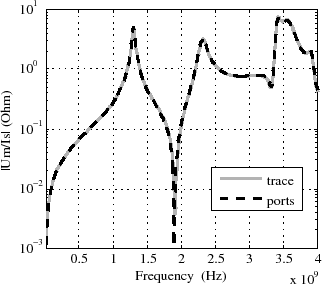
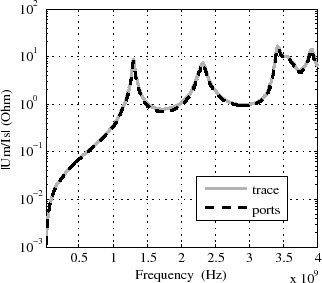
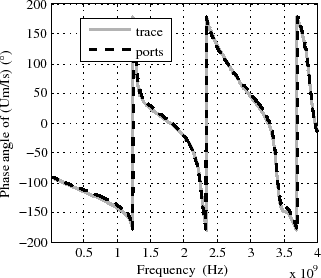
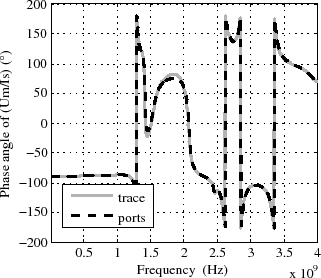
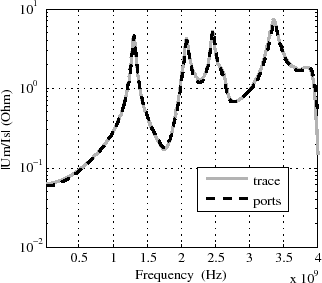
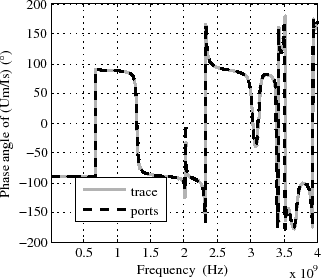
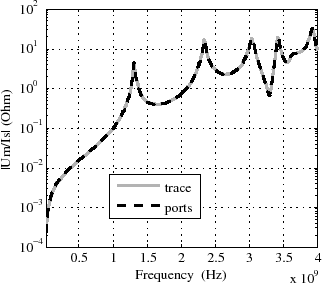
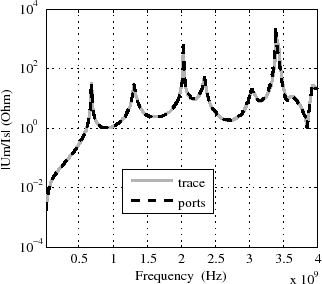
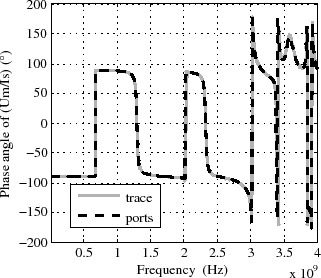
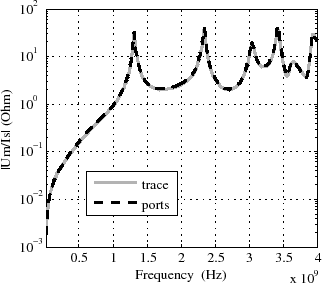
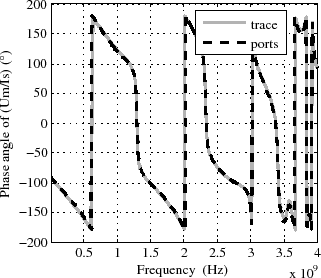
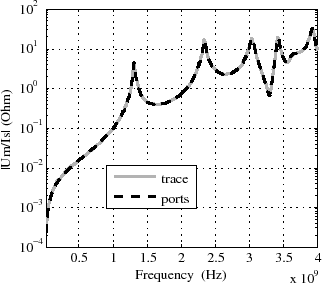
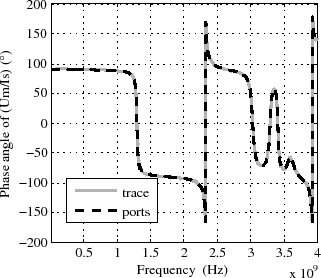
| Load: 0 Ohm, magnitude. | Load: 0 Ohm, phase
angle. |
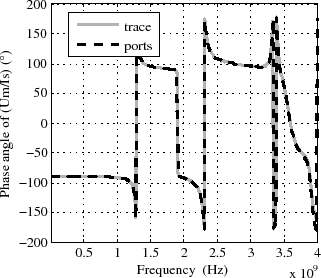
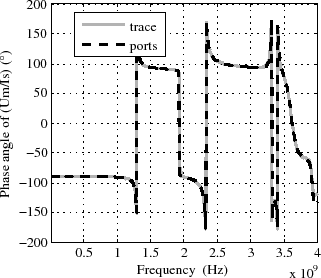
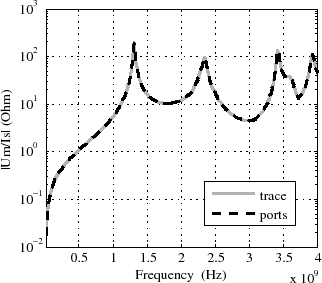
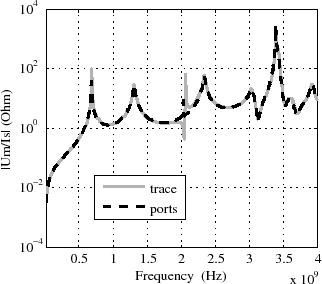
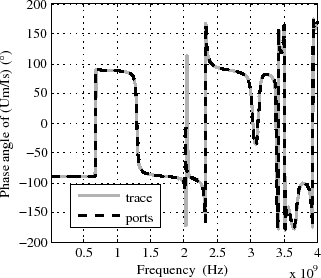
| Load: 1e9 Ohm, magnitude. | Load: 1e9 Ohm,
phase angle. |
| Load: 50 Ohm, magnitude. | Load: 50 Ohm, phase
angle. |
Figure A.29:
Transfer impedance from the trace source current to the slot measurement port at
(67mm,104mm). The trace is located at position (67mm,50mm) and the trace length is 5mm.
Trace orientation in y-direction. Comparison of HFSSresults from a model with a trace
and the results obtained with (5.6), (5.9) and a HFSSmodel with ports. The
enclosure height h=10mm.
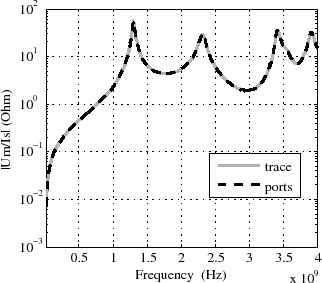
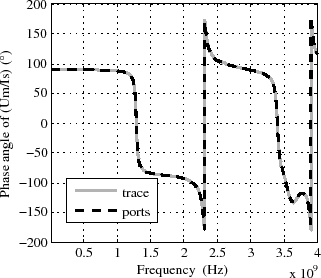
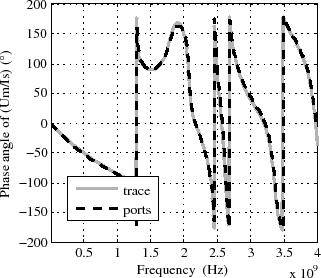
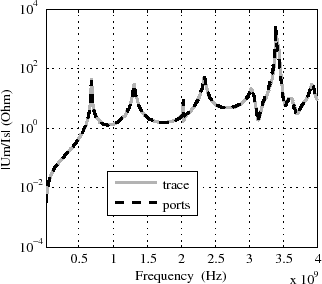
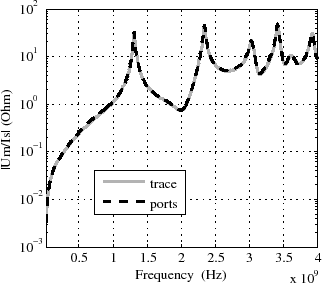
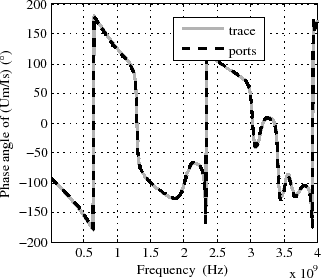
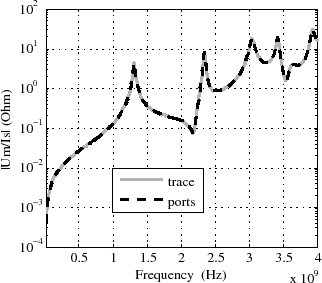
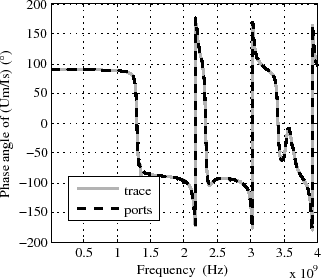
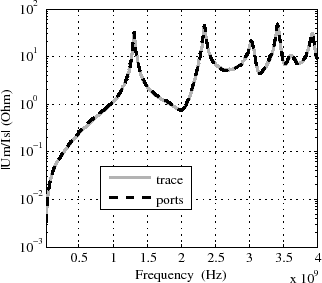
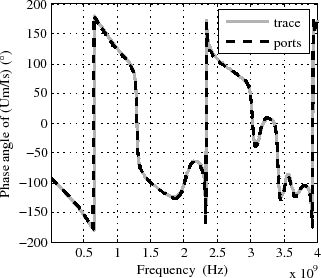
| Load: 0 Ohm, magnitude. | Load: 0 Ohm, phase
angle. |
| Load: 1e9 Ohm, magnitude. | Load: 1e9 Ohm,
phase angle. |
| Load: 50 Ohm, magnitude. | Load: 50 Ohm, phase
angle. |
Figure A.30:
Transfer impedance from the trace source current to the slot measurement port at
(10mm,104mm). The trace is located at position (67mm,50mm) and the trace length is 5mm.
Trace orientation in y-direction. Comparison of HFSSresults from a model with a trace
and the results obtained with (5.6), (5.9) and a HFSSmodel with ports. The
enclosure height h=10mm.
| Load: 0 Ohm, magnitude. | Load: 0 Ohm, phase
angle. |
| Load: 1e9 Ohm, magnitude. | Load: 1e9 Ohm,
phase angle. |
| Load: 50 Ohm, magnitude. | Load: 50 Ohm, phase
angle. |
Figure A.31:
Transfer impedance from the trace source current to the slot measurement port at
(124mm,104mm). The trace is located at position (67mm,50mm) and the trace length is 5mm.
Trace orientation in y-direction. Comparison of HFSSresults from a model with a trace
and the results obtained with (5.6), (5.9) and a HFSSmodel with ports. The
enclosure height h=10mm.
| Load: 0 Ohm, magnitude. | Load: 0 Ohm, phase
angle. |
| Load: 1e9 Ohm, magnitude. | Load: 1e9 Ohm,
phase angle. |
| Load: 50 Ohm, magnitude. | Load: 50 Ohm, phase
angle. |
Figure A.32:
Transfer impedance from the trace source current to the slot measurement port at
(67mm,104mm). The trace is located at position (67mm,50mm) and the trace length is 5mm.
Trace orientation in y-direction. Comparison of HFSSresults from a model with a trace
and the results obtained with (5.6), (5.9) and a HFSSmodel with ports. The
enclosure height h=15mm.
| Load: 0 Ohm, magnitude. | Load: 0 Ohm, phase
angle. |
| Load: 1e9 Ohm, magnitude. | Load: 1e9 Ohm,
phase angle. |
| Load: 50 Ohm, magnitude. | Load: 50 Ohm, phase
angle. |
Figure A.33:
Transfer impedance from the trace source current to the slot measurement port at
(10mm,104mm). The trace is located at position (67mm,50mm) and the trace length is 5mm.
Trace orientation in y-direction. Comparison of HFSSresults from a model with a trace
and the results obtained with (5.6), (5.9) and a HFSSmodel with ports. The
enclosure height h=15mm.
| Load: 0 Ohm, magnitude. | Load: 0 Ohm, phase
angle. |
| Load: 1e9 Ohm, magnitude. | Load: 1e9 Ohm,
phase angle. |
| Load: 50 Ohm, magnitude. | Load: 50 Ohm, phase
angle. |
Figure A.34:
Transfer impedance from the trace source current to the slot measurement port at
(124mm,104mm). The trace is located at position (67mm,50mm) and the trace length is 5mm.
Trace orientation in y-direction. Comparison of HFSSresults from a model with a trace
and the results obtained with (5.6), (5.9) and a HFSSmodel with ports. The
enclosure height h=15mm.

| Load: 0 Ohm, magnitude. | Load: 0 Ohm, phase
angle. |
| Load: 1e9 Ohm, magnitude. | Load: 1e9 Ohm,
phase angle. |
| Load: 50 Ohm, magnitude. | Load: 50 Ohm, phase
angle. |
Figure A.35:
Transfer impedance from the trace source current to the slot measurement port at
(67mm,104mm). The trace is located at position (67mm,50mm) and the trace length is 5mm.
Trace orientation in y-direction. Comparison of HFSSresults from a model with a trace
and the results obtained with (5.6), (5.9) and a HFSSmodel with ports. The trace
height is d=1.5mm.
| Load: 0 Ohm, magnitude. | Load: 0 Ohm, phase
angle. |
| Load: 1e9 Ohm, magnitude. | Load: 1e9 Ohm,
phase angle. |
| Load: 50 Ohm, magnitude. | Load: 50 Ohm, phase
angle. |
Figure A.36:
Transfer impedance from the trace source current to the slot measurement port at
(10mm,104mm). The trace is located at position (67mm,50mm) and the trace length is 5mm.
Trace orientation in y-direction. Comparison of HFSSresults from a model with a trace
and the results obtained with (5.6), (5.9) and a HFSSmodel with ports. The trace
height is d=1.5mm.
| Load: 0 Ohm, magnitude. | Load: 0 Ohm, phase
angle. |
| Load: 1e9 Ohm, magnitude. | Load: 1e9 Ohm,
phase angle. |
| Load: 50 Ohm, magnitude. | Load: 50 Ohm, phase
angle. |
Figure A.37:
Transfer impedance from the trace source current to the slot measurement port at
(124mm,104mm). The trace is located at position (67mm,50mm) and the trace length is 5mm.
Trace orientation in y-direction. Comparison of HFSSresults from a model with a trace
and the results obtained with (5.6), (5.9) and a HFSSmodel with ports. The trace
height is d=1.5mm.
| Load: 0 Ohm, magnitude. | Load: 0 Ohm, phase
angle. |
| Load: 1e9 Ohm, magnitude. | Load: 1e9 Ohm,
phase angle. |
| Load: 50 Ohm, magnitude. | Load: 50 Ohm, phase
angle. |
Figure A.38:
Transfer impedance from the trace source current to the slot measurement port at
(67mm,104mm). The trace is located at position (67mm,50mm) and the trace length is 5mm.
Trace orientation in y-direction. Comparison of HFSSresults from a model with a trace
and the results obtained with (5.6), (5.9) and a HFSSmodel with ports. The trace
height is d=3mm.
| Load: 0 Ohm, magnitude. | Load: 0 Ohm, phase
angle. |
| Load: 1e9 Ohm, magnitude. | Load: 1e9 Ohm,
phase angle. |
| Load: 50 Ohm, magnitude. | Load: 50 Ohm, phase
angle. |
Figure A.39:
Transfer impedance from the trace source current to the slot measurement port at
(10mm,104mm). The trace is located at position (67mm,50mm) and the trace length is 5mm.
Trace orientation in y-direction. Comparison of HFSSresults from a model with a trace
and the results obtained with (5.6), (5.9) and a HFSSmodel with ports. The trace
height is d=3mm.
| Load: 0 Ohm, magnitude. | Load: 0 Ohm, phase
angle. |
| Load: 1e9 Ohm, magnitude. | Load: 1e9 Ohm,
phase angle. |
| Load: 50 Ohm, magnitude. | Load: 50 Ohm, phase
angle. |
Figure A.40:
Transfer impedance from the trace source current to the slot measurement port at
(124mm,104mm). The trace is located at position (67mm,50mm) and the trace length is 5mm.
Trace orientation in y-direction. Comparison of HFSSresults from a model with a trace
and the results obtained with (5.6), (5.9) and a HFSSmodel with ports. The trace
height is d=3mm.

| Load: 0 Ohm, magnitude. | Load: 0 Ohm, phase
angle. |
| Load: 1e9 Ohm, magnitude. | Load: 1e9 Ohm,
phase angle. |
| Load: 50 Ohm, magnitude. | Load: 50 Ohm, phase
angle. |
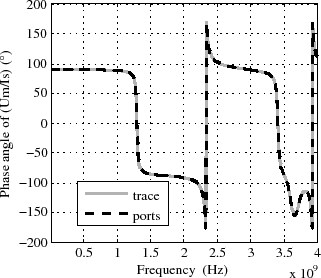
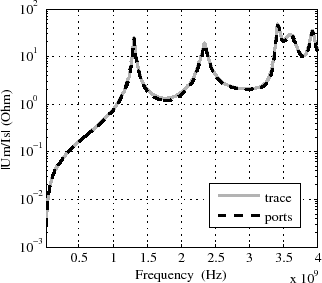
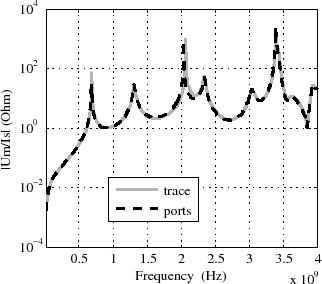
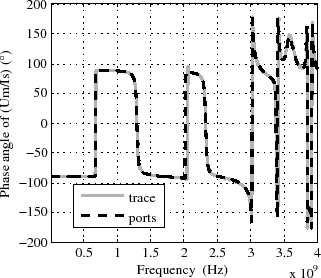
Figure A.41:
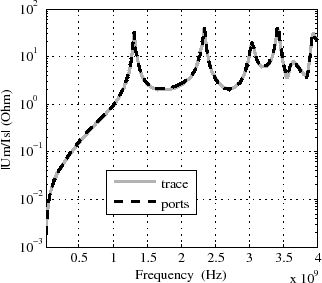
Transfer impedance from the trace source current to the slot measurement port at (67mm,104mm). Comparison of HFSS results from a model with a trace 5mm trace at position (67mm,50mm) to the results obtained with (5.6), (5.9) and a HFSS model with ports. The trace height is d=0.65mm.
| Load: 0 Ohm, magnitude. | Load: 0 Ohm, phase
angle. |
| Load: 1e9 Ohm, magnitude. | Load: 1e9 Ohm,
phase angle. |

| Load: 50 Ohm, magnitude. | Load: 50 Ohm, phase
angle. |
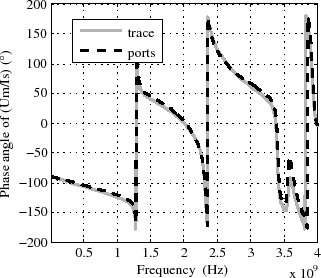
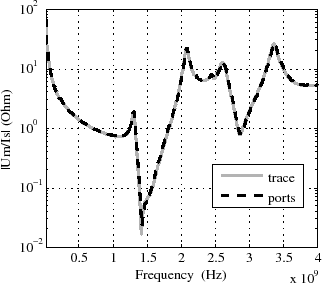
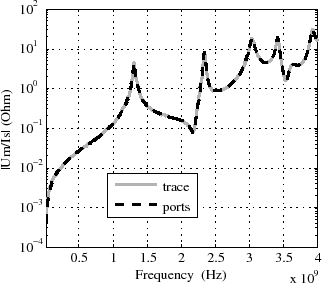
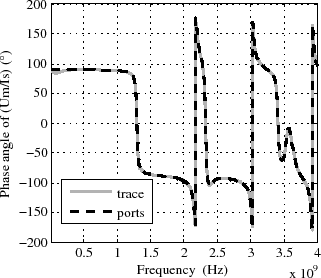
Figure A.42:
Transfer impedance from the trace source current to the slot measurement port at (10mm,104mm). Comparison of HFSS results from a model with a trace (Figure 5.7(a)) and the results obtained with (5.6), (5.9) and a HFSS model with ports.
| Load: 0 Ohm, magnitude. | Load: 0 Ohm, phase
angle. |
| Load: 1e9 Ohm, magnitude. | Load: 1e9 Ohm,
phase angle. |
| Load: 50 Ohm, magnitude. | Load: 50 Ohm, phase
angle. |
Figure A.43:
Transfer impedance from the trace source current to the slot measurement port at (124mm,104mm). Comparison of HFSS results from a model with a trace (Figure 5.7(a)) and the results obtained with (5.6), (5.9) and a HFSS model with ports.
| Load: 0 Ohm, magnitude. | Load: 0 Ohm, phase
angle. |
| Load: 1e9 Ohm, magnitude. | Load: 1e9 Ohm,
phase angle. |
| Load: 50 Ohm, magnitude. | Load: 50 Ohm, phase
angle. |
Figure A.44:
Transfer impedance from the trace source current to the slot measurement port at (67mm,104mm). Comparison of HFSS results from a model with a trace (Figure 5.7(b)) and the results obtained with (5.6), (5.9) and a HFSS model with ports.
| Load: 0 Ohm, magnitude. | Load: 0 Ohm, phase
angle. |
| Load: 1e9 Ohm, magnitude. | Load: 1e9 Ohm,
phase angle. |
| Load: 50 Ohm, magnitude. | Load: 50 Ohm, phase
angle. |
Figure A.45:
Transfer impedance from the trace source current to the slot measurement port at (124mm,104mm). Comparison of HFSS results from a model with a trace (Figure 5.7(b)) and the results obtained with (5.6), (5.9) and a HFSS model with ports.
C. Poschalko: The Simulation of Emission from Printed Circuit Boards under a Metallic Cover