Next: 6. Summary and Outlook Up: 5.3 Effect of Current Crowding and Microstructure Previous: 5.3.2 Current Crowding
The experimental observations implies that even if current crowding and consequent intensive material transport are expected close to the interconnect corner, their effect on electromigration failure is negligible. From these observations, one may conclude that, while both microstructural and geometric factors play important roles, microstructure has the most significant impact on the electromigration failure. As previous studies have shown [25], sites where grain boundaries meet the liner or the etch-stop are natural points of weak adhesion. High values of vacancy concentration and tensile stress are observed close to these locations. This implies that voids most probably nucleate at these sites.
The application of the simulation procedure, which includes the grain boundary and material interfaces models, to the geometries described before allows one to investigate the void nucleation process in multigrain structures. The solutions of the full physical electromigration model are identified in values of vacancy concentration and tensile stress. The peak values of vacancy concentration and corresponding peaks of tensile stress are extracted at the geometrical ends of the studied interconnect shapes (spot S1 in (5.16)) and at the triple points of microstructures (spot S2 in (5.16)). In the studied case the peaks at triple points are more important, particularly those which are distributed in the vicinity of current crowding region.
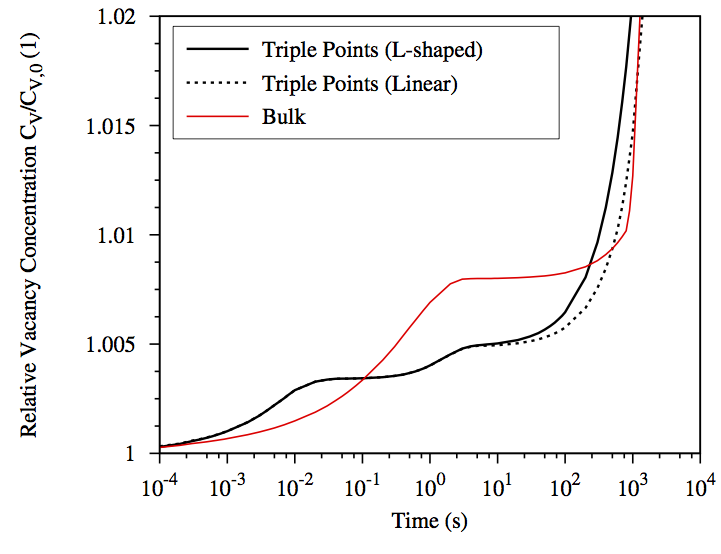 |
The time evolution of the maximum relative vacancy concentration in both linear and angled lines is illustrated in (5.18). As expected, by monitoring the local change of vacancy concentration in time close to the cathode end of the line, the three stages of vacancy dynamics are observed (red curve in (5.18)). Such a behavior was already discussed in Section 5.1.2, where it was referred to as the quasi-steady state. When the primary material transport paths along which electromigration acts are recognized to be the grain boundaries and material interfaces, a different behavior in vacancy dynamics is observed (black curves in (5.18)). According to the models presented in Section 5.1.2 the difference in the vacancy dynamics for this case is due to the fact that grain boundaries and interfaces are able to trap and release vacancies with a rate which corresponds to the generation/annihilation term [40]. Since the value of release rate Ωr is much lower than the trapped rate Ωt (see table 5.4), the trapped vacancy concentration within the triple point increases. The vacancy trapping/release events at the triple point lead to the generation of tensile stress. As observed in (5.18), the peak vacancy concentration, extracted at the triple point, develops in a different manner compared to the trend shown for the vacancy concentration obtained at the geometrical end. In the latter the transition from the quasi-steady state to the phase of rapid growth of stress occurs later. According to this result, it is obvious that a defect site, such as a triple point, indicates the location where a rapid increase in stress and vacancy concentration initially takes place.
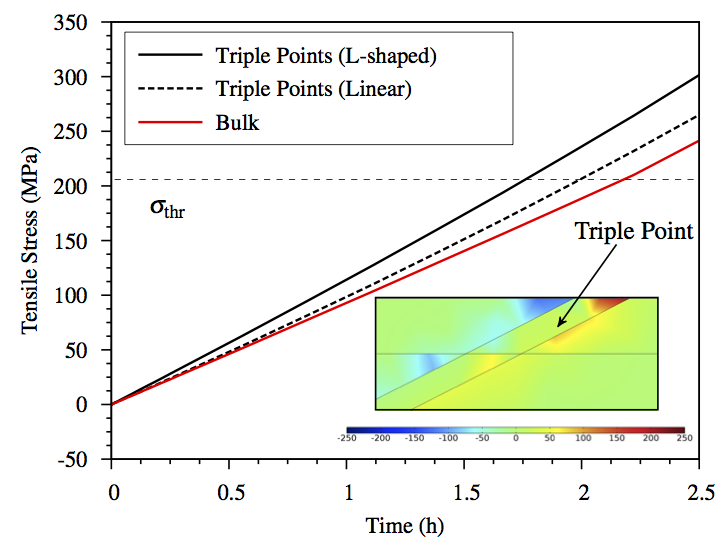
The primary goal is to confirm that the triple point represents the site where the stress, and the consequent void nucleation, develops prior to other locations. The time evolution of the tensile stress in both structures is depicted in (5.19). Using a threshold stress value σthr of 200MPa as the failure criterion, it is possible to conclude that the electromigration lifetime of the given structures is represented as the time required to reach the threshold value for void nucleation. The behavior of the stress evolution in the structure follows the local changes in time of vacancy concentration. As shown in (5.19), the time necessary to reach the threshold stress for void nucleation at the triple point is lower compared to the time needed to reach the same stress value at the geometrical end of the lines. This means that a void most probably nucleates at sites away from the cathode end of the line. The stress build-up follows the increase in the trapped vacancy concentration and develops at the triple point, as can be seen in the cross section view of the triple point in (5.19). As presented in Section 1.4.5 void nucleation is observed at locations where there is an available site of weak adhesion. Grain boundaries and material interfaces are typical features which provide such sites. In particular, triple points are formed by the intersection between grain boundaries and material interfaces and represent natural locations of weak adhesion. The simulation results are therefore able to explain the reason behind void nucleation at sites away from the geometrical ends of the lines.
Furthermore, by comparing the simulation results obtained for the linear and L-shaped geometries, the time needed to nucleate a stable void in linear geometries is more time than necessary for void nucleation in angled structures. This leads to a conclusion that void nucleation primarily occurs in L-shaped structures at the same applied stress conditions of increased temperature and current density. Under these stress conditions, it should be pointed out that the differences between failure times (i.e. void nucleation times) observed in the linear and angled interconnects are quite small, approximately in the range of minutes.
The introduction of the grain boundary network into the geometries, together with the application of grain boundary and material interface models, provides an improvement of the analysis and permits one to explain the experimental observations regarding electromigration-induced void nucleation. Electromigration voiding in the two simulated interconnect geometries is not determined by the presence of current crowding at the interconnect corner, but rather it depends on the influence of the grain boundary network, in particular triple points. In addition, with the help of this improved model, it is possible to determine the location of void nucleation in the structures and to provide a qualitative estimation of their lifetimes.
 |